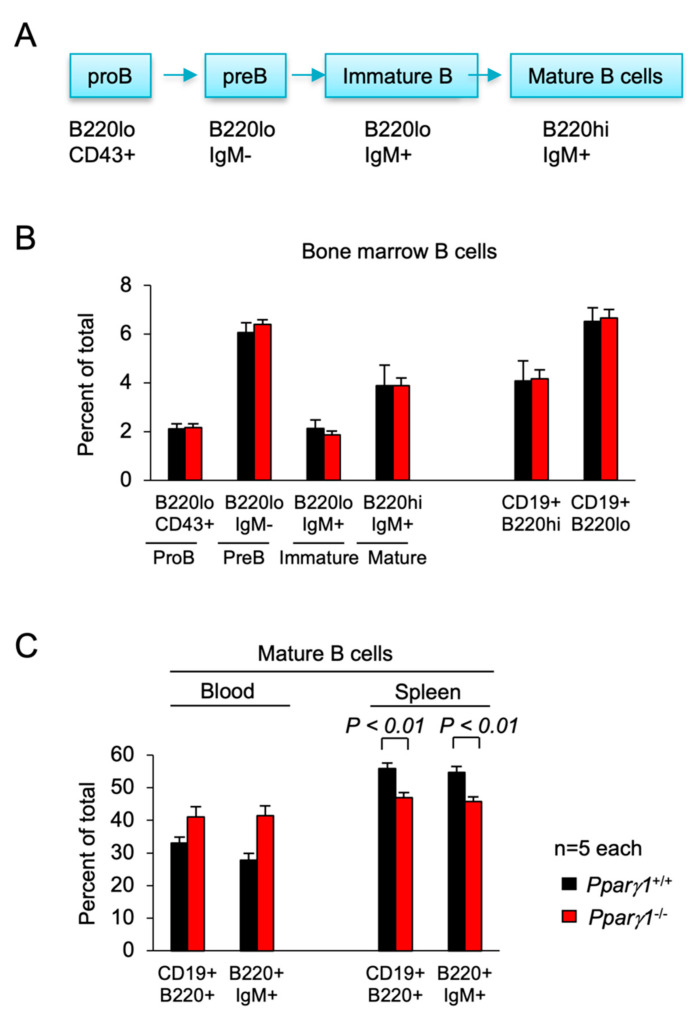
Figure 4.
B cell differentiation in Pparγ1+/+ vs. Pparγ1−/− multigenic mice. (A). Schematic representation of lineage differentiation from pro B cells to mature B cells. (B). Lineage indices of Pparγ1+/+ vs. Pparγ1−/− multigenic mice (Pparγ1wt/wt, vs. Pparγ1fl/fl, both in ROSA26CreERT2, Rosa26mTmG and MMTV-ErbB2 background and treated with tamoxifen) with relative distribution of B cell lineage components in the bone marrow (BM). Relative proportion of Pro-B, Pre-B, Immature B cells, and Mature B cells (B220highIgM+) are shown. (C). The proportion of Mature B cells are shown for the blood and spleen. Data are represented as mean ± SEM. n = 10 total.

