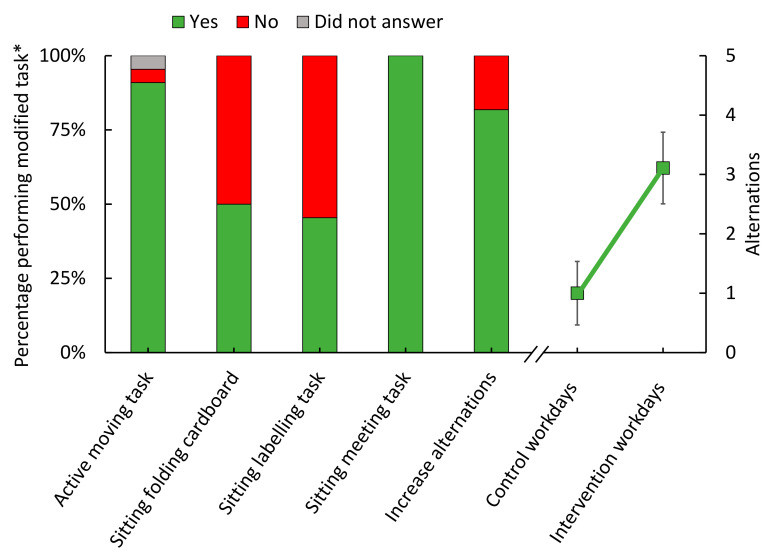
Figure 6.
Answers to whether modifications were performed as planned during ‘intervention’ workdays (n = 13), and the number of alternations between work tasks on ‘control’ and ‘intervention’ workdays (n = 14). The left y-axis represents the percentage of answers ‘yes’, ‘no’ or ‘did not answer’. The right y-axis represents the number of alternations between work tasks with different physical behaviors. Green squares indicate group mean and error bars represent standard deviation (SD) between workers. * Nine workers gave answers following both ‘intervention’ workdays (i.e., 18 answers), and four workers provided answers only on one workday (i.e., 4 answers), adding up to 22 answers (i.e., 100%).

