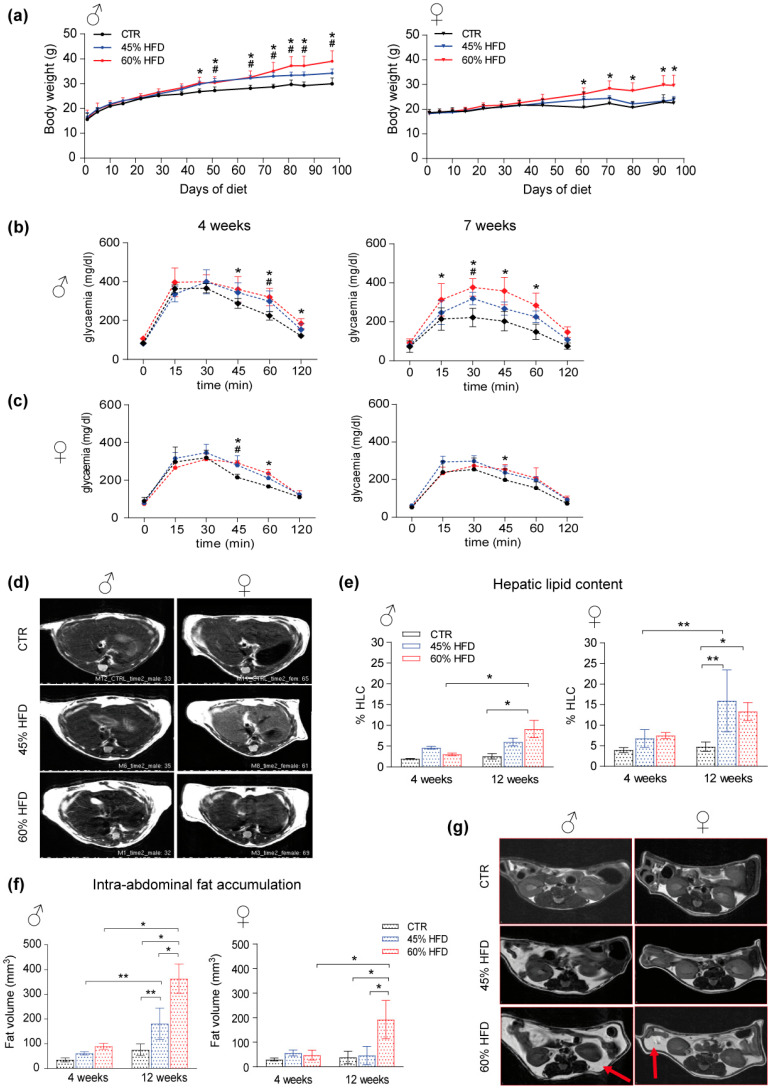
Figure 1.
High-fat animal model characterization. (a) male (♂, left) and female (♀, right) mice body weight increase (* significant variation in 60% HFD vs. CTR, # significant variation in 45% HFD vs. CTR). Data were analyzed using two-way ANOVA for diet and time point as variables, followed by Tukey’s post hoc test for multiple comparisons (n = 4, p-value < 0.05). (b) Longitudinal glucose tolerance test in male and (c) female HFD mice at 4 and 7 weeks of diet (* significant variation in 60% HFD vs. CTR, # significant variation in 45% HFD vs. CTR). Data were analyzed using two-way ANOVA in which within each row, each column mean was compared, followed by Tukey’s post hoc test for multiple comparisons (n = 4, p-value < 0.05). (d) T2-MRI images of male (left) and female liver (liver) section per group of study (CTR, 45% HFD and 60% HFD) at 12 weeks of diet. Non-fat suppression images in which whiter liver reveals higher lipid content. (e) % Hepatic lipid content (% HLC) spectroscopy evaluation on male (left) and female (right) liver section at 4 and 12 weeks of diet (* significant variation p-value < 0.05, ** significant variation p-value < 0.01). (f) Fat volume longitudinal quantification in male (left) and female (right) mice at 4 and 12 weeks of diet. Data were analyzed using two-way ANOVA for diet and time point as variables, followed by Tukey’s post hoc test for multiple comparisons. All data were expressed as mean ± SD (* significant variation p-value < 0.05, ** significant variation p-value < 0.01). (g) T2-MRI representation of male (left) and female (right) intra-abdominal fat accumulation per group of diet (CTR, 45% HFD and 60% HFD) at 12 weeks of diet; red arrows indicate fat tissue accumulation.

