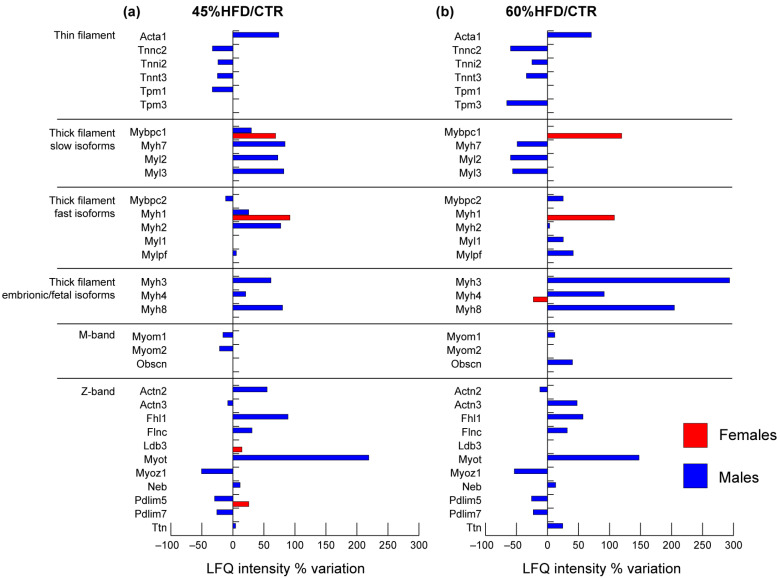
Figure 4.
Proteomic analysis of contractile proteins. Histograms of differentially expressed proteins (LFQ intensity% variation, ANOVA and Tukey’s test, n = 10, p-value < 0.05) in (a) 45% HFD vs. standard diet (CTR) female (red bars) and male (blue bars) mice; (b) 60% HFD vs. CTR female and male mice.

