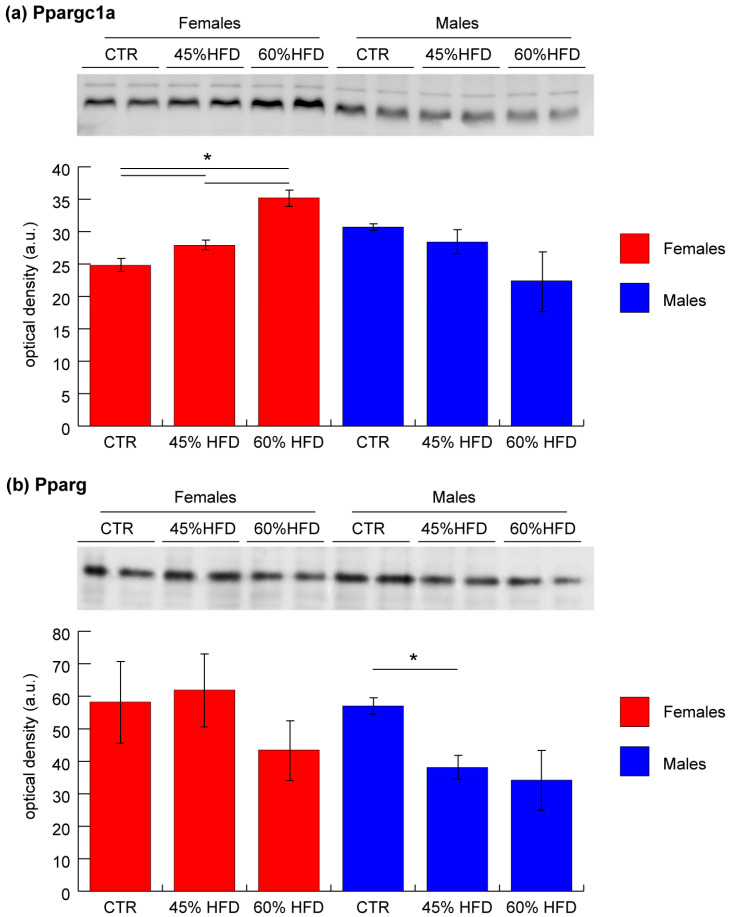
Figure 8.
Representative histograms and immunoblot images of (a) peroxisome proliferator-activated receptor gamma coactivator 1-alpha (Ppargc1a) and (b) peroxisome proliferator-activated receptor gamma (Pparg) expression in gastrocnemius muscle (mean ± SD; * = significant difference, ANOVA and Tukey’s test, n = 2, p-value < 0.05) of CTR, 45% HFD and 60% HFD female (red) and male (blue) mice. Full-length images are available in Supplementary Figure S1.

