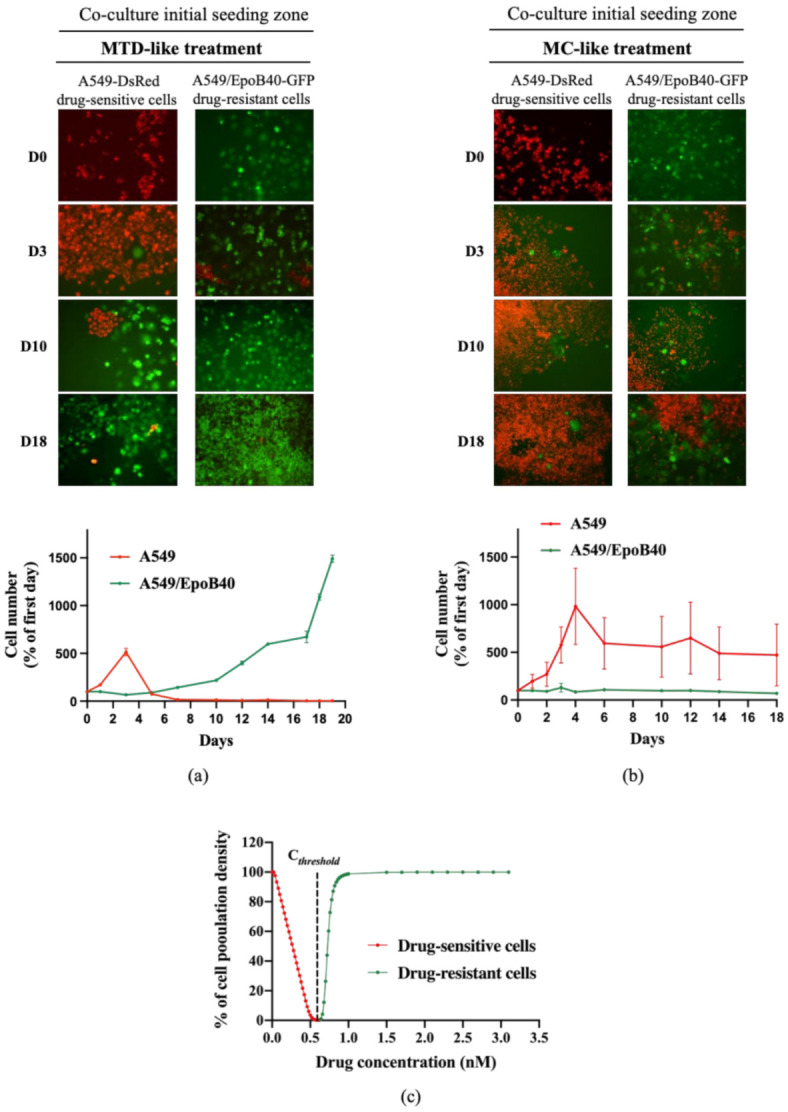
Figure 3.

The metronomic schedule prevents the selection of drug-resistant clones in 2D NSCLC co-culture models. (a,b) Representative fluorescent pictures of A549-DsRed drug-sensitive cells and A549/EpoB40-GFP drug-resistant cells (magnification factor ×10) over time under MTD-like treatment (a) or MC-like treatment (b). Cell number of A549 and A549/EpoB40 by recording fluorescent signals (DsRed and GFP) over time under MTD- and MC-like treatments is also represented. Data were expressed as a percentage of cell number from day 0. (c) Percentage of the carrying capacity of the well occupied by cell populations after a 30-day in silico experiment depending on the drug concentration. Red: the well was mainly filled with drug-sensitive cells at the end of the experiment, and green: the well was mainly filled with drug-resistant cells at the end of the experiment.
