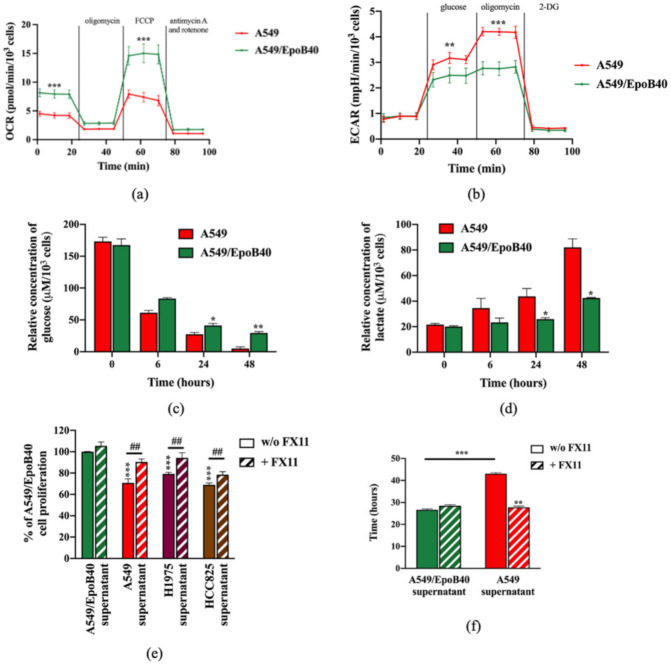
Figure 6.
Drug-sensitive A549 clones have a higher glycolytic profile than drug-resistant A549/EpoB40 clones. (a,b) A549 and A549/EpoB40 cells were analyzed for (a) mitochondrial bioenergetics and (b) glycolysis using the Seahorse XF technology (OCR: Oxygen Consumption Rate and ECAR: ExtraCellular Acidification Rate). (c,d) Supernatants from A549 and A549/EpoB40 were collected over time and analyzed for (c) glucose consumption and (d) lactate production by using the YSI 2900 instrument. (e) A549/EpoB40 cell proliferation was measured by crystal violet assay at 72 h after daily exposition to cell-free supernatants from A549, H1975 or HCC825 cultures previously incubated with or without 3 µM of FX11. Supernatants from A549/EpoB40 cultures that were subjected to the same treatment were used as a control. Results were expressed as a percentage of control cell proliferation. (f) A549/EpoB40 cell growth was followed by a real-time impedance-based method. A549/EpoB40 cells were exposed daily to cell-free supernatants from A549 and A549/EpoB40 cultures that were previously incubated with or without 3 µM of FX11. Doubling time of A549/EpoB40 cells was calculated in different conditions. Data are shown as means ± SEM. * p < 0.05; ** p < 0.01; *** p < 0.001; ## p < 0.01 (* comparison to A549/EpoB40 supernatant w/o FX11 and # comparison between w/o FX11 and FX11 treated conditions).

