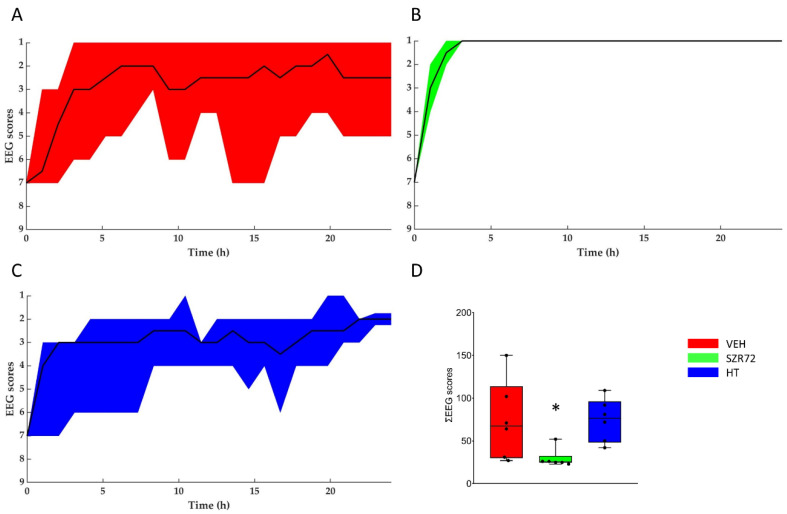
Figure 5.
Regeneration of the brain electrical activity shown with the amplitude-based EEG scoring system. (A–C): The black lines show the medians, whereas the colors indicate the interquartile ranges. At the onset of reoxygenation after asphyxia, the EEG was flat in all animals (score 7); afterward, it gradually restored to a continuous electrical activity. Quick restoration of EEG activity was conspicuous in the SZR72 group. (D): the box plot shows the sum of the EEG scores determined in each hour of the post-insult observation period. The black line is the median, the box shows the interquartile range, the whiskers show the 10th–90th percentiles, and the bullets are the raw data points. The SZR72 group had significantly lower values, in agreement with the quicker and more complete restoration of EEG activity. * p < 0.05 significantly different from the VEH group.

