Figure 7.
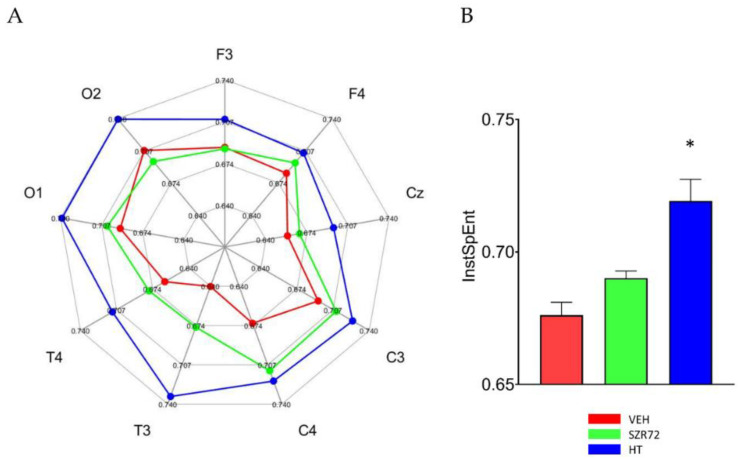
Instantaneous spectral entropy (InstSpEnt) of the EEG signal at 24 h after asphyxia. (A): In the spider chart, the average values obtained in the respective EEG leads are shown. In most leads, InstSpEnt values of the VEH group are the smallest representing the least signal complexity, followed by the values in the SZR72 group. In all leads, the HT group unequivocally produced the signal with the highest entropy. (B): The bar graph shows the InstSpENt averages of all leads, indicating similar entropy values in the VEH and SZR72 group EEG signal, which are significantly smaller than the values obtained in the HT group. * p < 0.05, significantly different from the corresponding value of the VEH group.

