Figure 8.
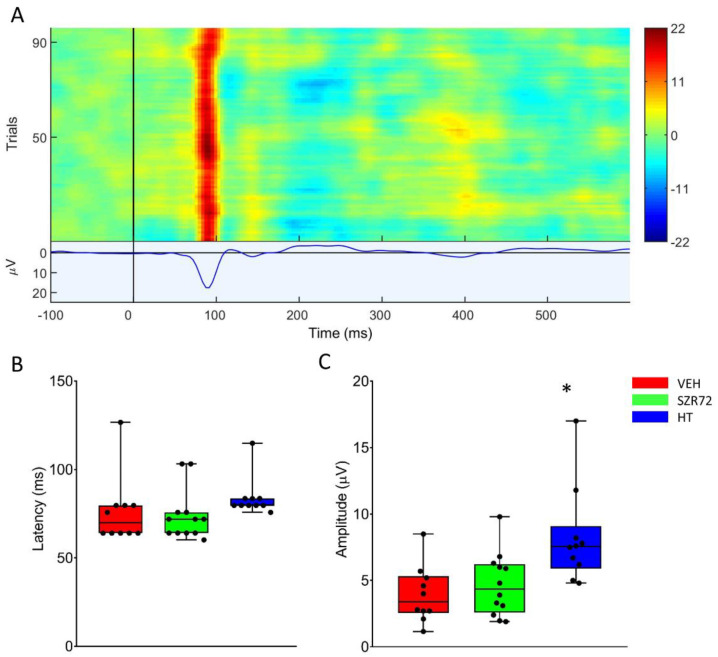
Visual evoked potentials (VEP) evoked at 24 h after asphyxia. (A): The heat map shows the responses to the 100 individual light stimuli, constituting the VEP waveform displaying a marked P100 component in a representative record. (B): There was no difference among the groups among P100 latency that were unaffected by asphyxia. (C): P100 amplitudes in the VEH and SZR72 groups were similar, both decreased from pre-asphyxia baselines. The HT group displayed the highest P100 amplitudes, indicating the best preservation of function. The black line is the median, the box shows the interquartile range, the whiskers show the 10th–90th percentiles, and the bullets are the raw data points. Baseline P100 amplitudes were 8.7 ± 1.7, 8.1 ± 0.6, and 12.0 ± 1.8 µV (mean ± SEM) for VEH, SZR72, and HT groups, respectively. * p < 0.05, significantly different from the corresponding value of the VEH group.

