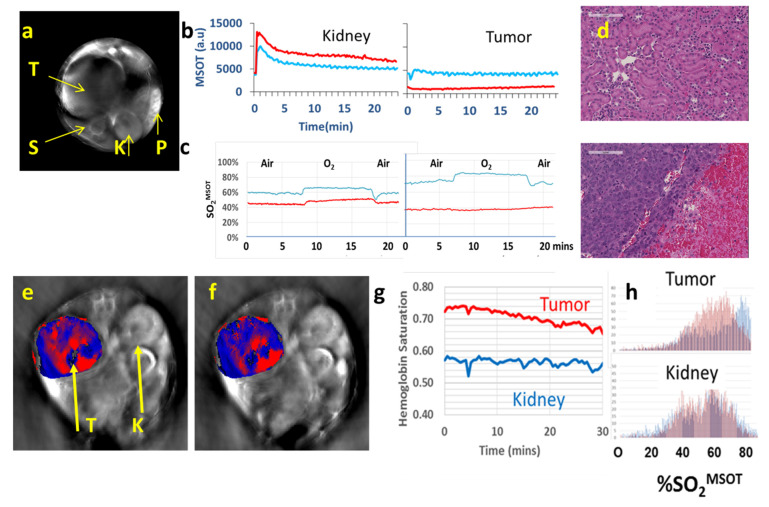
Figure 9.
Photoacoustic assessment of vascular disruption in kidney tumors. (a) MSOT of orthotopic RENCA tumor in BALB/C mouse. Transaxial 800 nm MSOT image showing tumor (T), spine (S), contra lateral kidney (K) and spleen (P). (b) Dynamic contrast enhanced MSOT accompanying IV infusion of the blood pool agent Genhance. Similar curves were observed at baseline (blue) and 24 h (red) in kidney. In tumor, inflow of Genhance was observed at baseline, but much less at 24 h commensurate with vascular shutdown matching. Blue baseline and red 24 h after OXi8007 (350 mg/kg). (c) Traces showing hemoglobin oxygen saturation derived from dynamic MSOT images in spine and tumor accompanying oxygen-breathing challenge. Traces for the tumor showing baseline response, but no activity after 24 h indicating vascular shutdown. Area under the curve indicates about 95% less signal. (d) H&E stained section of RENCA tumor (lower panel) and contralateral kidney (upper panel) from resected tissue obtained 72 h after OXi8007. Extensive hemorrhage is seen in the tumor. (e) Acute response of human RCC XP373 to CA4P. Distinct anatomy is apparent in the transaxial slice MSOT image showing tumor (T) and contralateral control kidney (K). Red indicates predominant oxyhemoglobin and blue deoxyhemoglobin in tumor at baseline. (f) Regional hypoxiation is seen in the tumor vasculature following CA4P. (g) Dynamic changes were observed in tumor over 30 min following CA4P (120 mg/kg, IP), while contralateral normal kidney showed no change as confirmed in (h) histograms, verifying selective activity against the tumor.

