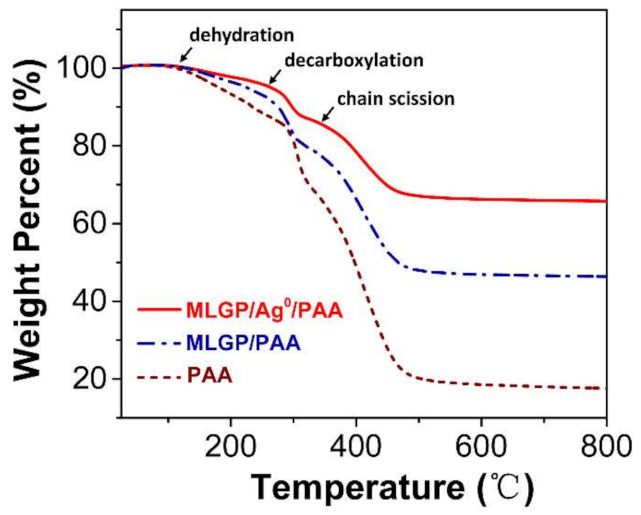
Figure 6.

TGA curves of three different hydrogels. The brown, blue, and red lines indicate pure PAA, MLGP/PAA, and MLGP/Ag0/PAA hydrogels, respectively.

TGA curves of three different hydrogels. The brown, blue, and red lines indicate pure PAA, MLGP/PAA, and MLGP/Ag0/PAA hydrogels, respectively.