Table 2.
Clinical pattern of preoperative PET/CT in all 86 patients.
| PET/CT Scan Uptake Classification 1 | Scheme | Description | No. of Patients (%) | Representative PET/CT Image |
|---|---|---|---|---|
| Type I |

|
Completely hot uptake type, no defect area | 24 (27.9%) |
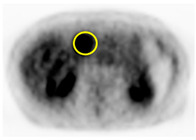
|
| Type II |

|
Focal defect area with almost type I background | 18 (20.9%) |
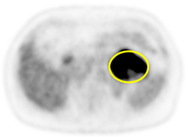
|
| Type III |

|
Multiple or geographic uptake with defective background | 23 (26.7%) |
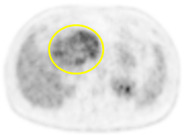
|
| Type IV |

|
Focal uptake with mainly defective background | 18 (20.9%) |
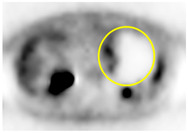
|
| Type V |

|
No uptake, completely defective background | 3 (3.5%) |
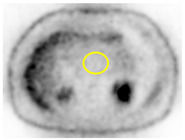
|
Values are n (%), mean ± standard deviation. PET/CT, positron emission tomography/computed tomography; 1 PET/CT scan uptake classification was described in a previous report [17].
