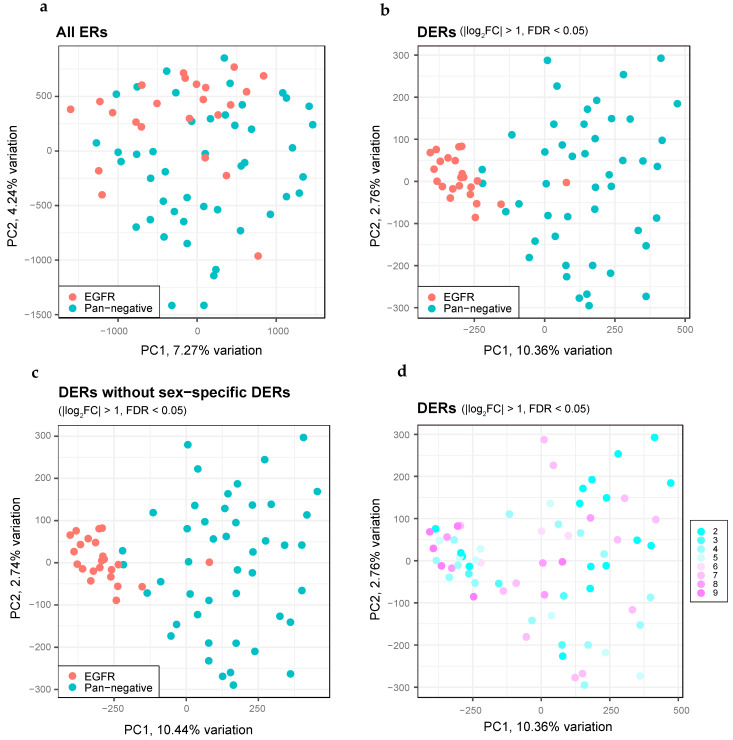
Figure 6.
Distinct features of DERs between EGFR-mutant and pan-negative LUADs obtained by H3K27ac ChIP-seq. (a) PCA plots for all ERs, comparing EGFR-mutant (red dots, n = 23) and pan-negative (blue dots, n = 46) LUADs. (b) The same as panel (a) but showing PCA plots for DERs. (c) The same as panel (b) but we excluded DERs on the sex chromosomes. (d) The same as panel (b) but we highlighted the elapsed time (years) of each FFPE tissue in colors.

