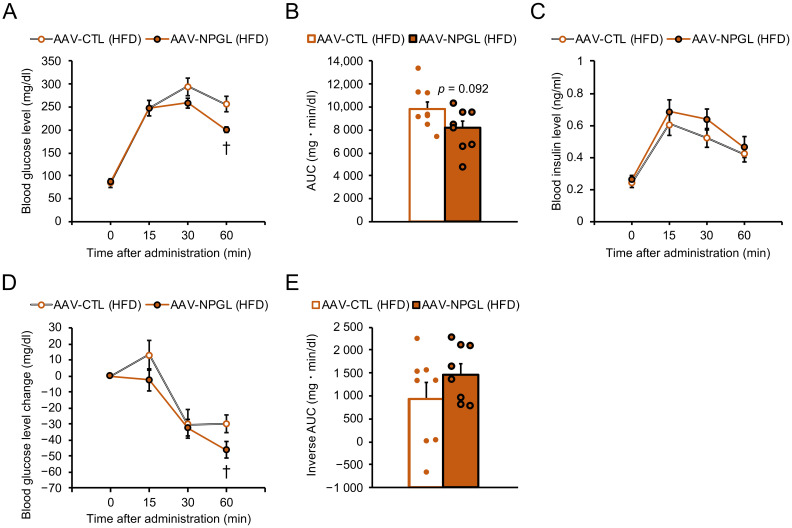
Figure 3.
Effects of Npgl overexpression on glucose tolerance and insulin sensitivity in high-fat diet (HFD)-fed mice. The panels show the data obtained upon injection of the AAV-based control vector (AAV-CTL) or the AAV-based NPGL-precursor gene vector (AAV-NPGL) in HFD-fed mice. (A–C) Results of oral glucose tolerance test (OGTT) ((A): blood glucose levels, (B): area under the curve (AUC) for blood glucose levels, (C): corresponding blood insulin secretion curves) for HFD-fed mice at multiple time points. (D,E) Results of intraperitoneal insulin tolerance test (IPITT) ((D): changes in blood glucose levels compared with those at time 0, (E): inverse AUC for blood glucose levels) for HFD-fed mice at multiple time points. Circles in (B,E) represent individual data points. Each value represents the mean ± standard error of the mean (n = 8; † p < 0.05 for Student’s t-test).

