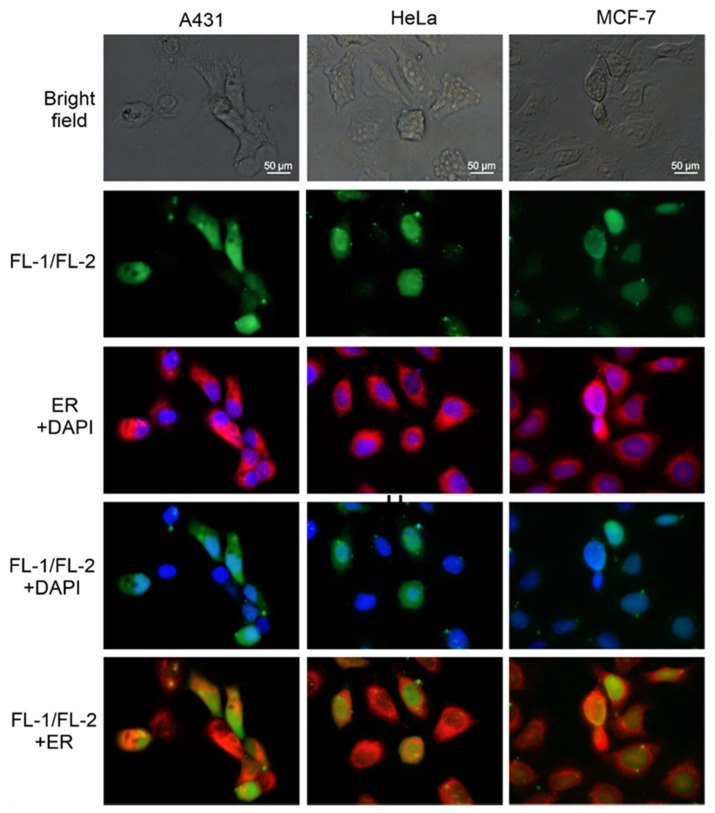
Figure 4.
Localization of the FL-1/FL-2 nanostructures in A431, HeLa, and MCF-7 cancer cells (6 h after transfection). Visualization of green fluorescent B-ASO spots and merged blue cell nuclei (DAPI) and red ER membranes (ER-Tracker Red) are shown in rows 2 and 3, respectively. Merged images of the FL-1/FL-2 nanostructures either with cell nuclei or with ER are shown in rows 4 and 5, respectively. All panels were enlarged 60 times.

