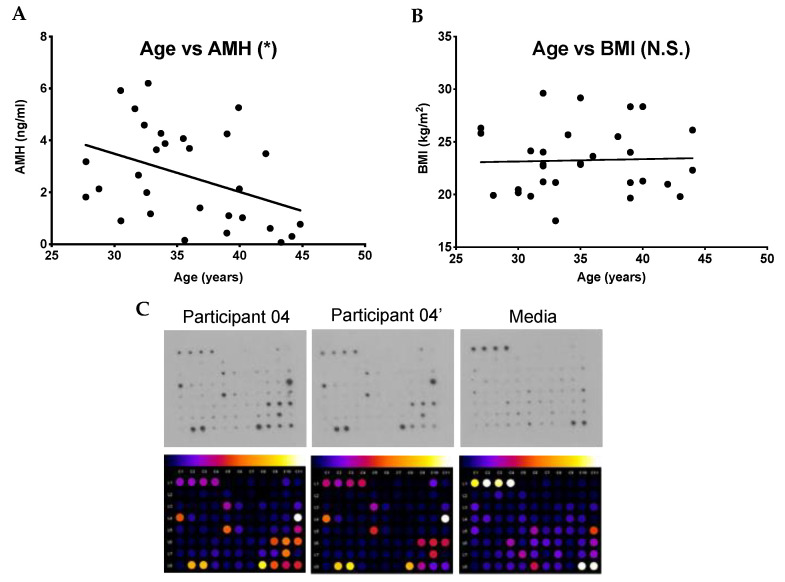
Figure 1.
Relationship between age and anti-Müllerian hormone (AMH) and body mass index (BMI) and sample cytokine antibody array (A) Graph demonstrating that with increasing age, there was a statistically significant inverse correlation with AMH in our sample population (total n = 30). (B) Graph demonstrating that with increasing age, there was no statistically significant correlation with BMI in our population. (C) Representative human cytokine array C5 performed on the follicular fluid from the first follicle aspirated from either the right (participant 04) or left ovary (participant 04′) from a single participant. One array was incubated in media alone to determine the background and thus, establish signal thresholds. The lines in (A) and (B) correspond to the fitted regression equation. * p < 0.05, N.S. = no statistical significance.

