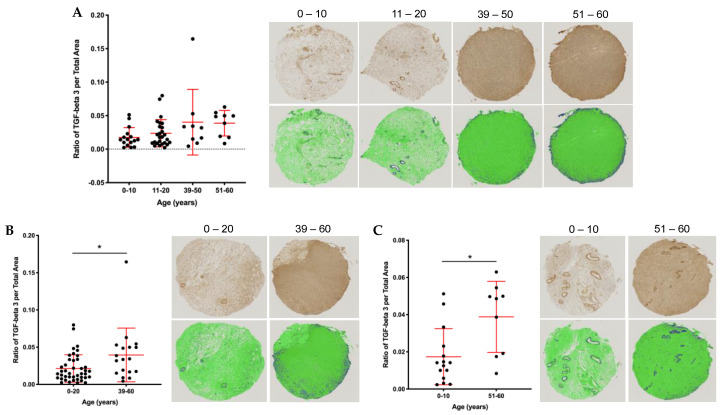
Figure 6.
Quantitative analysis of human ovarian tissue microarray (TMA) reveals increased TGFβ3 content with age. (A) Average ratio of TGFβ3 expression per total area for core 1 and core 2 (unique cores from the same patient) broken down into four age cohorts: 0–10, 11–20, 39–50, 51–60. Images from cores closest to the average data point in each age cohort are shown with TGFβ3 staining (brown) in the panel above and quantitative data analysis in green and blue below. The dark blue area represents a positive TGFβ3 signal above the threshold, while green is TGFβ3 negative. (B) Ratio of TGFβ3 per total area in the 0–20 vs. 39–60 age cohorts. (C) Ratio of TGFβ3 per total area in the 0–10 vs. 51–60 age cohorts. Asterisks (*) indicate statistical significance with panel (B) p = 0.01 and panel (C) p = 0.005.

