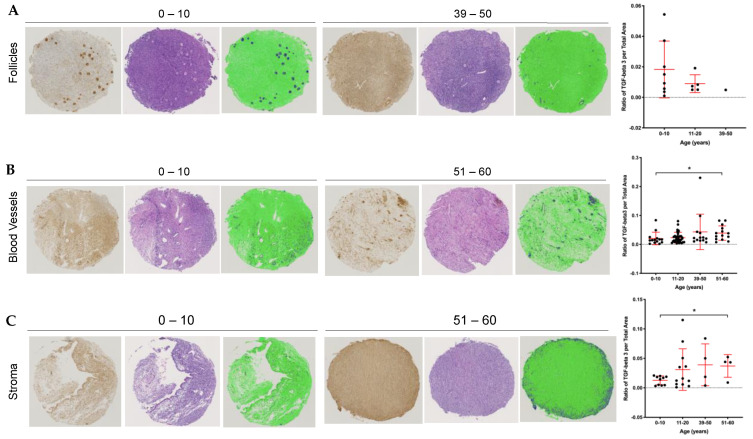
Figure 7.
Analysis of ovarian cores from the TMA reveal changes in TGFβ3 content with age depending on the presence of landmark tissue structures. Each core was categorized into one of three major tissue structures: follicles, blood vessels or stroma. Representative images of youngest and oldest age cohort’s cores are shown with the first panel: TGFβ3 staining in the brown, middle panel: hematoxylin and eosin stain and last panel: quantitative data measurement with positive TGFβ3 signal in dark blue and negative TGFβ3 stain in green. (A) Average core 1 and 2 ratios of TGFβ3 per total area across age cohorts with follicles. (B) Average core 1 and 2 ratios of TGFβ3 per total area across age cohorts with blood vessels. (C) Average core 1 and 2 ratios of TGFβ3 per total area across age cohorts with stroma. Asterisks (*) indicate statistical significance with panel (B) p = 0.04 and panel (C) p = 0.004.

