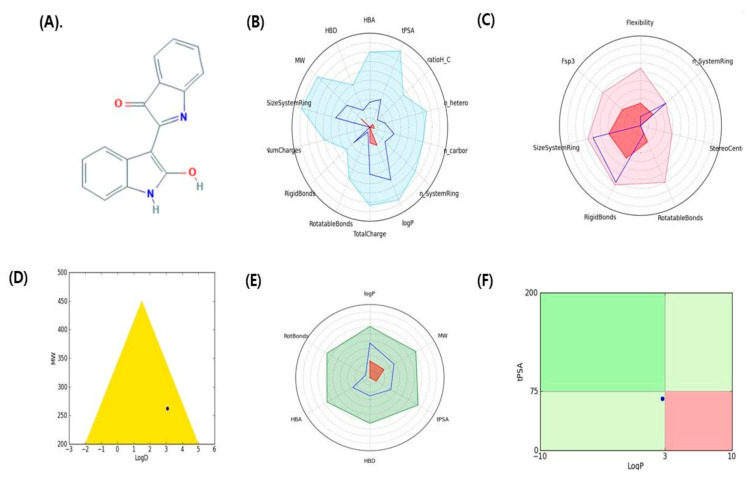
Figure 2.
Graphical representation of pharmacokinetic properties of indirubin. (A) 2D structure indirubin, (B) Physicochemical filter positioning of ligand, (C) Complexity of ligand, (D) Golden triangle rule (dot represents the position of compound), (E) Oral absorption, (F) Pfizer rule (dot represents the position of compound).

