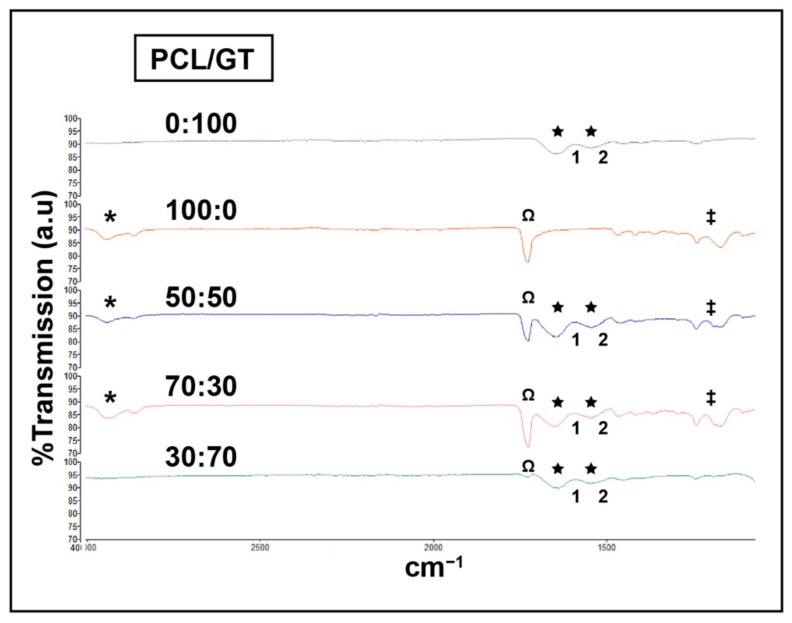
Figure 4.
FTIR spectra of PCL/GT nanofibers. Blended composite PCL and GT contained both polymer’s spectrum as indicated by the distinctive peaks. * H-C-H stretching, Ω carbonyl (C=O) stretching, ‡ C-O-C stretching indicates PCL presence. ★ Common bands of protein (indicates the presence of GT); 1. C-O stretching, 2. N-H and C-N (peptide bond) stretching.

