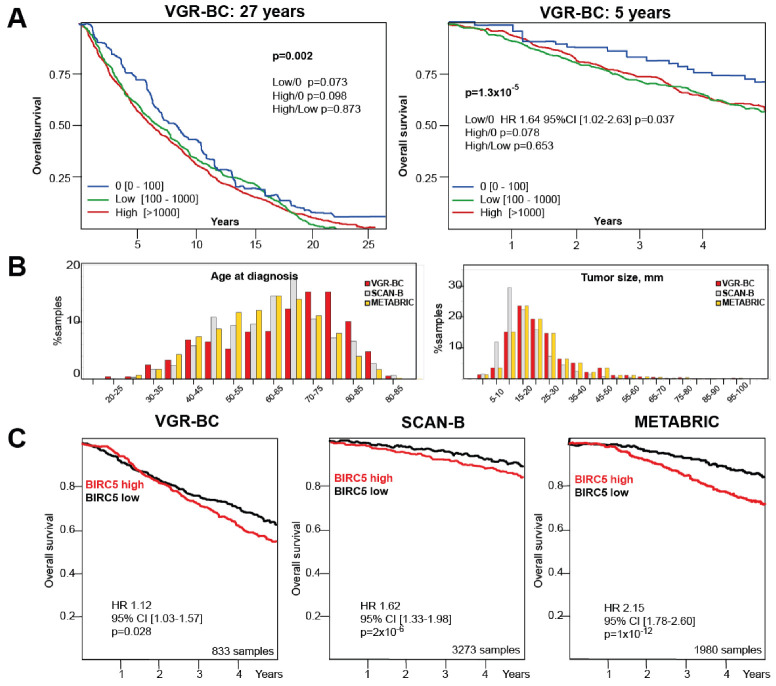
Figure 1.
BIRC5/survivin levels contribute to survival probability in three independent breast cancer cohorts of different data and clinical characteristics. (A) Kaplan-Meier curves depict 27 and 5 years of overall survival for the VGR-BC cohort, split by the BIRC5/survivin levels into “0”, below the threshold (n = 66); “Low” (100–1000 pg/1 g total protein, n = 536) and ”High” ( >1000 pg/1 g total protein, n = 234) BIRC5/survivin levels. Mantel-Cox log rank test was used for pairwise comparisons. (B) Comparative analysis of VGR-BC, SCAN-B, and METABRIC cohorts. Histograms present the age distributions at diagnosis and tumor size within VGR-BC, SCAN-B, and METABRIC cohorts. Percent of total samples size was independently calculated for each cohort. (C) Kaplan-Meier curves depict 5-year overall survival probability for patients of the VGR-BC, SCAN-B, and METABRIC cohorts. Survival curves shown for total datasets, split to the BIRC5/survivin median level was done based on the protein levels in the tumor lysates in the VGR-BC, and mRNA levels in SCAN-B and METABRIC. Hazard ratio was estimated separately for the high- and low-level patient groups.

