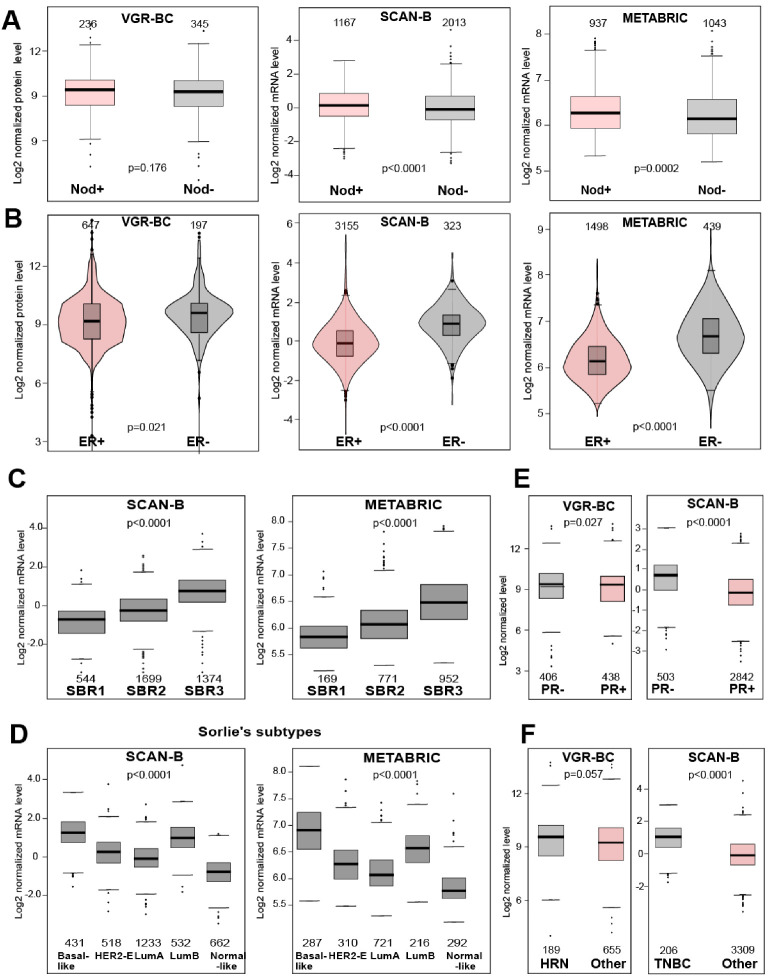
Figure 3.
BIRC5/survivin level variation across BC subtypes and clinical characteristics. (A) Boxplots show log2 normalized BIRC5/survivin levels in nodal-positive and nodal-negative tumors. p-values are obtained by the Welch and Mann-Whitney tests. Numbers indicate the sample size of the group. (B) Violin plots show the log2 normalized BIRC5/survivin levels in ER-positive and ER-negative tumors in the VGR-BC (protein data) and SCAN-B (RNA-seq data) cohorts. p-values are obtained by the Welch (SCAN-B and METABRIC) and Mann-Whitney (VGR-BC) tests. Numbers indicate the sample size of the group. (C) Boxplots show log2 normalized BIRC5/survivin mRNA levels in tumors with histological grading (according to Scarff-Bloom-Richardson grading, SBR) for the SCAN-B and METABRIC cohorts. p-values are obtained by the ANOVA test. (D) Boxplots show the log2 normalized BIRC5/survivin mRNA levels in the samples from the SCAN-B and METABRIC cohorts classified to different molecular subtypes (Sorlie’s). p-values are obtained by the ANOVA test. Numbers indicate the sample size of the group. (E) Boxplots show log2 normalized BIRC5/survivin levels in the PR-positive and PR-negative tumors. p-values are obtained by the Welch (SCAN-B) and Mann-Whitney (VGR-BC) tests. Numbers indicate the sample size of the group. (F) Boxplots show the log2 normalized BIRC5/survivin levels in the HRN and TNBC tumors. p-values are obtained by the Welch (SCAN-B) and Mann-Whitney (VGR-BC) tests. Numbers indicate the sample size of the group.

