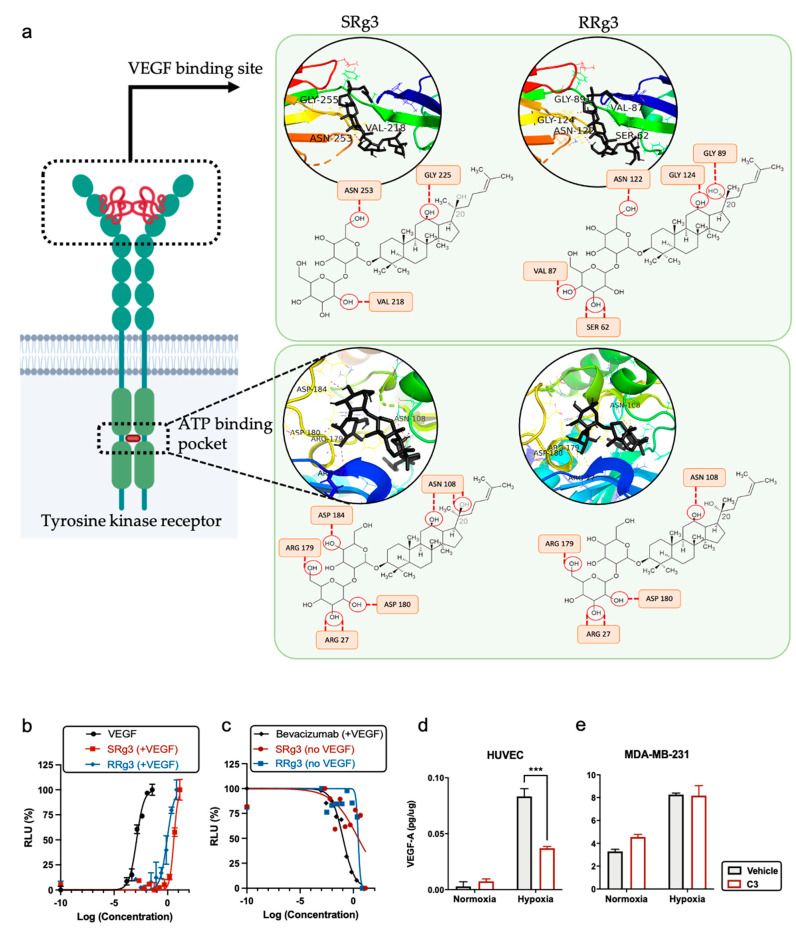
Figure 4.
(a) A demonstration of the interaction between SRg3 and RRg3 (in black) with VEGFR2 at VEGF binding site or ATP-binding pocket. The interaction sites were predicted using molecular docking performed by AutoDock Vina algorithm. The predicted H-bonds between Rg3 and amino acid residues are shown with dashed lines. Dose–response curve of (b) VEGF, SRg3, and RRg3 in the presence of 35 ng/mL VEGF (stimulatory dose–response state) and (c) bevacizumab in the presence of 35 ng/mL VEGF, SRg3, and RRg3 alone (inhibitory dose–response state). Expression of VEGF in the presence of Rg3 in normoxic or hypoxic conditions in (d) HUVEC and (e) MDA-MB-231. The experiment was performed in duplicate, and the results are shown as mean ± SD, with p < 0.05. RLU—relative light units. *** p < 0.001.

