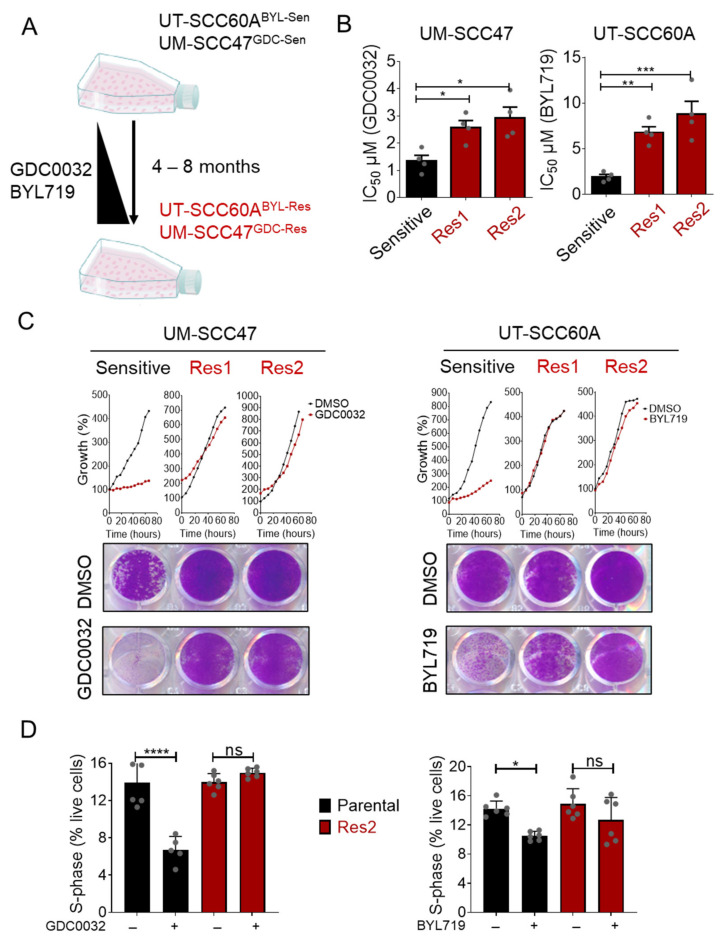
Figure 1.
Generation of isiPI3K-acquired resistance HNCHPV+ cell lines. (A) The indicated cell lines were cultured with increasing concentrations of either GDC0032 (100 nM up to 1 μM) or BYL719 (1 μM up to 4 μM) for 4 to 8 months, until resistance emerged. (B) One sensitive and two resistant cell lines (Res1 and Res2) of UM-SCC47 and of UT-SCC60A were cultured with DMSO and increasing concentrations of GDC0032 (0–2 μM) or BYL719 (0–10 μM) for 4 days. Cell viability was determined using crystal violet staining, and IC50 values were calculated. IC50 results of 4 separate experiments are presented as means ± SEM. Biological replicates from separate experiments are shown as grey dots. (C) UM- SCC47 and UT-SCC60A sensitive and resistant cell lines (Res 1 and Res2) were cultured with DMSO, GDC0032 (500 nM), or BYL719 (2 μM) for 4 days. A live cell imager monitored cell growth every 6 h, and cell confluency was calculated. At the end of the experiment, cells were stained with crystal violet for determination of final cell densities. Each proliferation experiment was repeated 3 separate times, and a representative experiment is presented. (D) UM- SCC47 and UT-SCC60A sensitive and resistant cell lines (Res2) were cultured with DMSO, GDC0032 (500 nM), or BYL719 (2 μM). Three days post-treatment, cell cycle analysis was performed, and the fraction of the cells in S-phase was determined. Cell cycle results of 2 separate experiments are presented as means ± SEM. Biological replicates from separate experiments are shown as grey dots. Statistical significance was calculated by one-way ANOVA, * p < 0.05; ** p < 0.01; *** p < 0.001; **** p < 0.0001.

