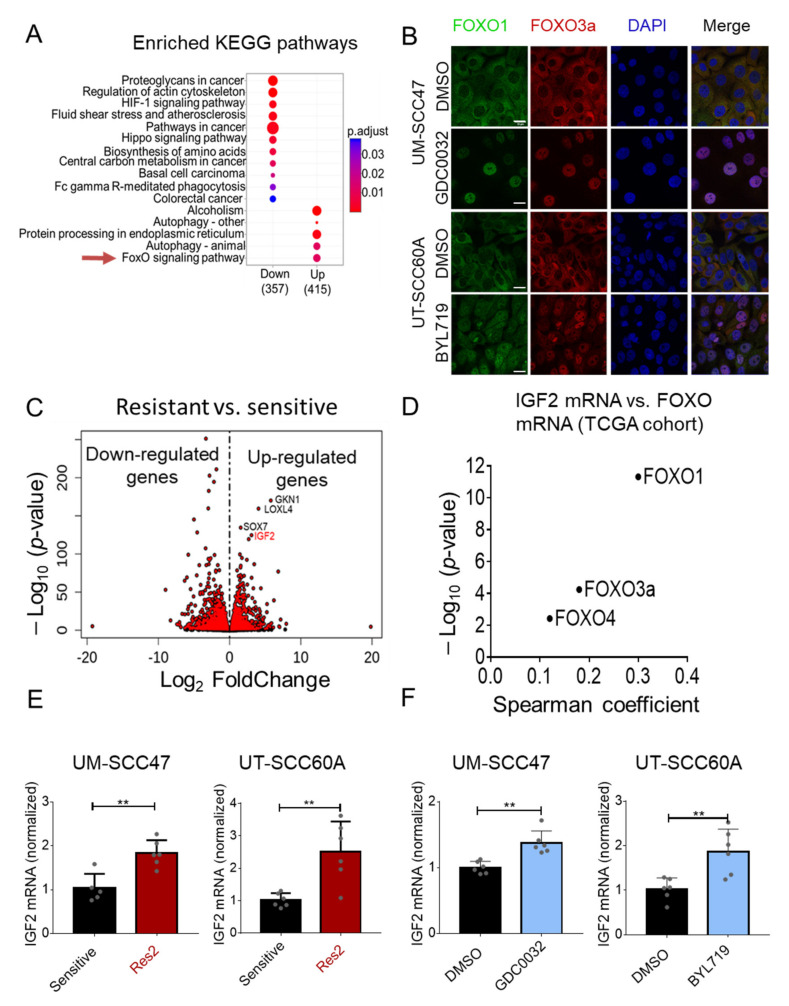
Figure 2.
isiPI3K resistant cells activate FOXO signaling pathway and upregulate the expression of IGF2. (A) The transcriptome of sensitive and resistant (Res2) UM-SCC47 and UT-SCC60A cells was profiled using RNAseq in 3 biological replicates per each cell line. Up- or down-regulated genes of UM-SCC47 and UT-SCC60A (resistant vs. sensitive) cells were identified using an adjusted p-value < 0.05 & FC > 1 as a cutoff. KEGG pathway enrichment analysis was performed on the list of genes whose expression was significantly different between the resistant and non-resistant cells. (B) UM-SCC47 and UT-SCC60A were cultured with DMSO, GDC0032 (500 nM), or BYL719 (2 μM) for 24 h, after which cells were fixed and stained using the indicated antibodies. The immunofluorescence experiment was repeated 3 times, and representative stained images of FOXO1, FOXO3a and DAPI from one of the experiments are presented. Scale bar: 20 μm. (C) Volcano plot visualizing the dysregulated genes (log2 fold change against −log10 p-value) between sensitive and resistant cells. (D) TCGA (Firehose Legacy) data show the correlation (Spearman coefficient against −log10 p-value) between IGF2 mRNA and mRNA levels of FOXO family members in HNC cancer patients. (E) RT-PCR analysis measuring IGF2 mRNA levels in sensitive UM-SCC47 and UT-SCC60A and resistant cells. (F) RT-PCR analysis determining IGF2 mRNA levels in UM-SCC47 and UT-SCC60A cell lines following 24 h of treatment with DMSO, GDC0032 (0.5 μM), or BYL719 (2 μM). RT-PCR results of 2 separate experiments are presented as means ± SEM. Biological replicates from separate experiments are shown as grey dots. Statistical significance was calculated by an unpaired t-test. ** p < 0.01.

