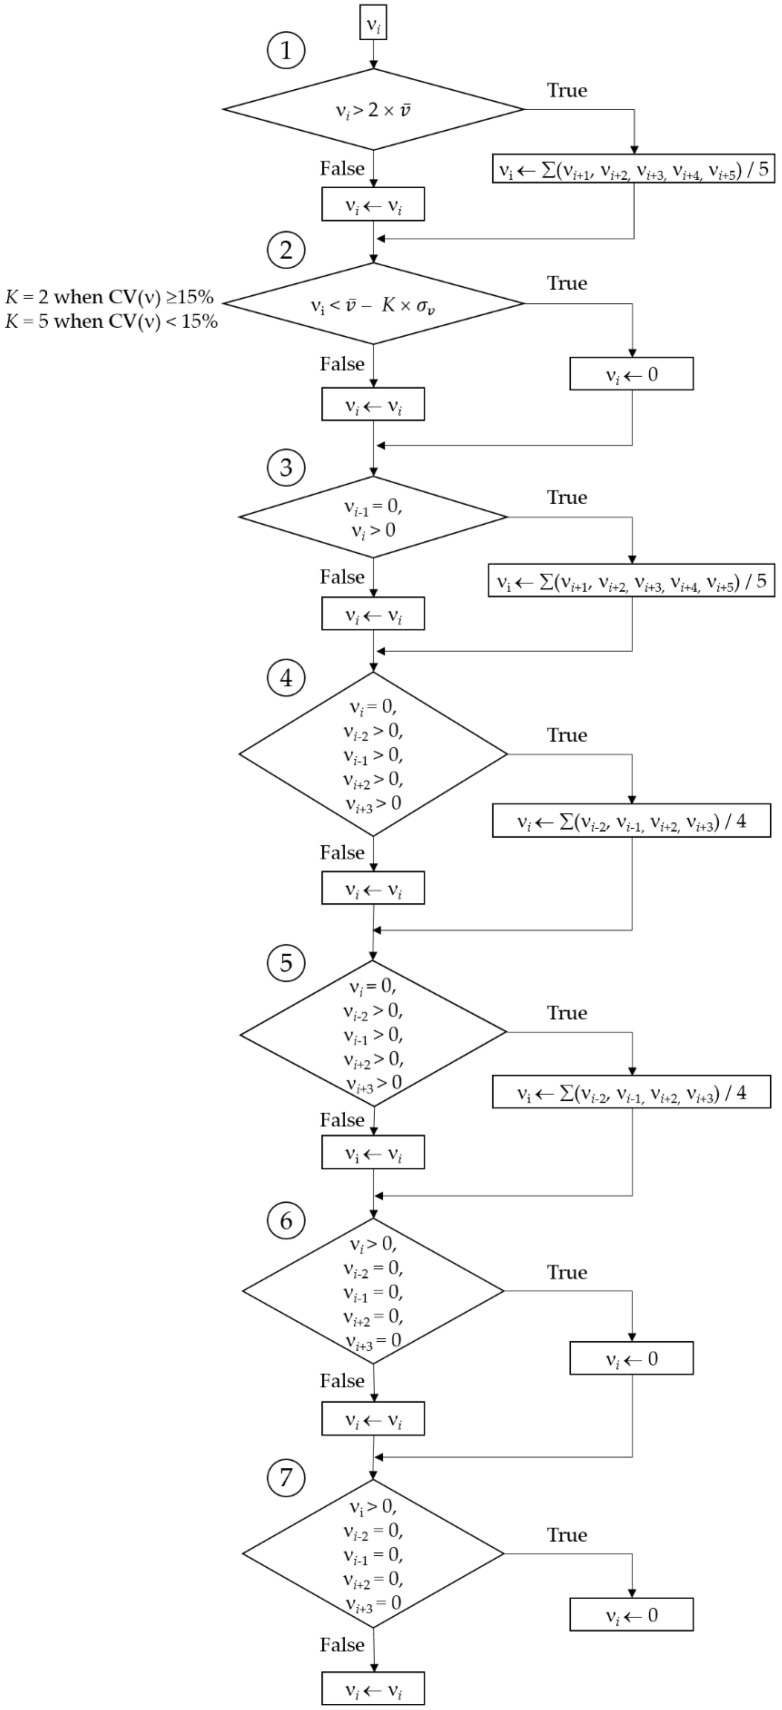
Figure 1.
Block diagram illustrating the speed (ν) data processing methodology. , , CV(ν) are the mean, standard deviation, and coefficient of variation of speed over the representative 120-s (or shorter if not possible) period of the session; νi is the speed value corresponding to the epoch i. At each of the seven steps, νi outputs (νi ←) are new values that are included in a new vector ν.

