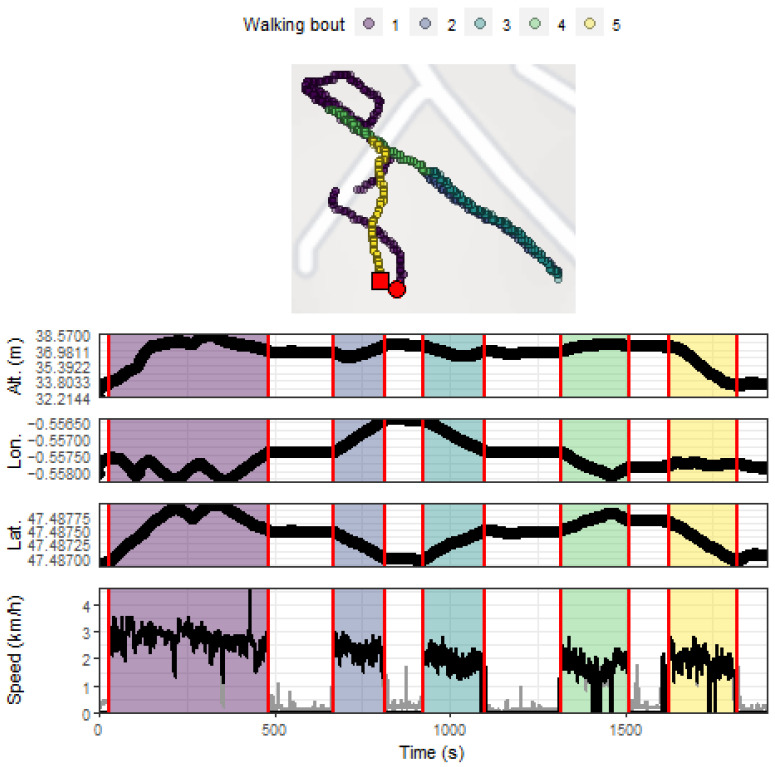
Figure 3.
Example of GPS data obtained during an outdoor walking session (Participant #1). The upper panel depicts the positions recorded during the session, with the red circle and square indicating the beginning and the end of the session, respectively. The colored zones in the middle and lower panels highlight the walking bouts detected using the implemented speed processing methodology [13]. The altitude values are those from the French National Institute of Geography map projections that corresponded to the latitude and longitude data recorded by the GPS device. Grey lines depict raw speed values obtained with the GPS device and that were transformed following the speed data processing procedure. Lat. = latitude; Lon = longitude; Alt. = altitude.

