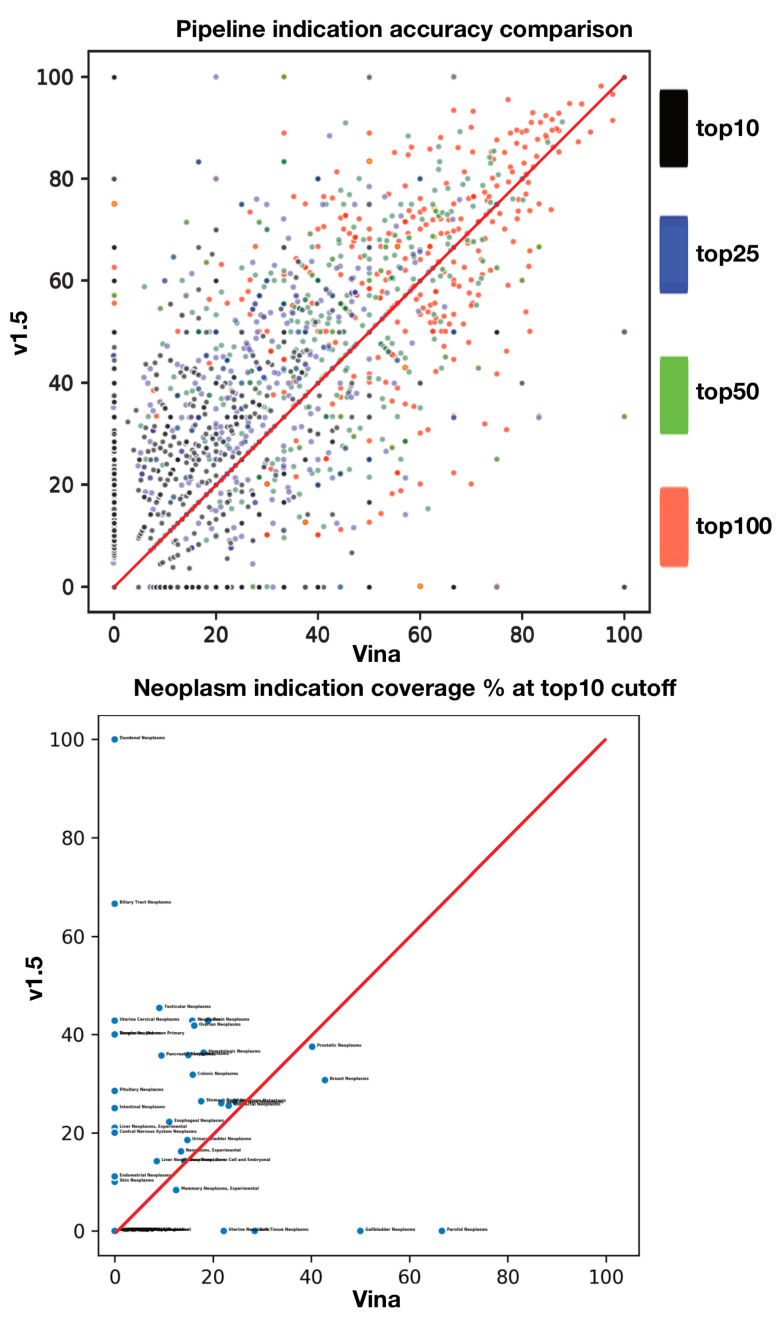
Figure 6.
Comparison of the indication accuracies at various cutoffs and for a defined indication class for two CANDO platform pipelines. The top panel denotes a symmetrical accuracy chart. Each axis measures the indication accuracy for each pipeline, and indications are plotted according to their corresponding accuracies (different cutoffs are distributed in alternate colors). Points that land on the 45 degree red line are indications where the pipelines reached consensus; points that fall closer to a particular axis achieved a relatively higher score with the corresponding pipeline. The bottom panel isolates indications for the defined class “neoplasm” comprising 39 indications with the corresponding string. The asymmetrical distribution of the accuracy plot suggests pipeline accuracy differentiation, i.e., different pipelines have differing performance strengths and weaknesses, on a per-indication and indication class level.

