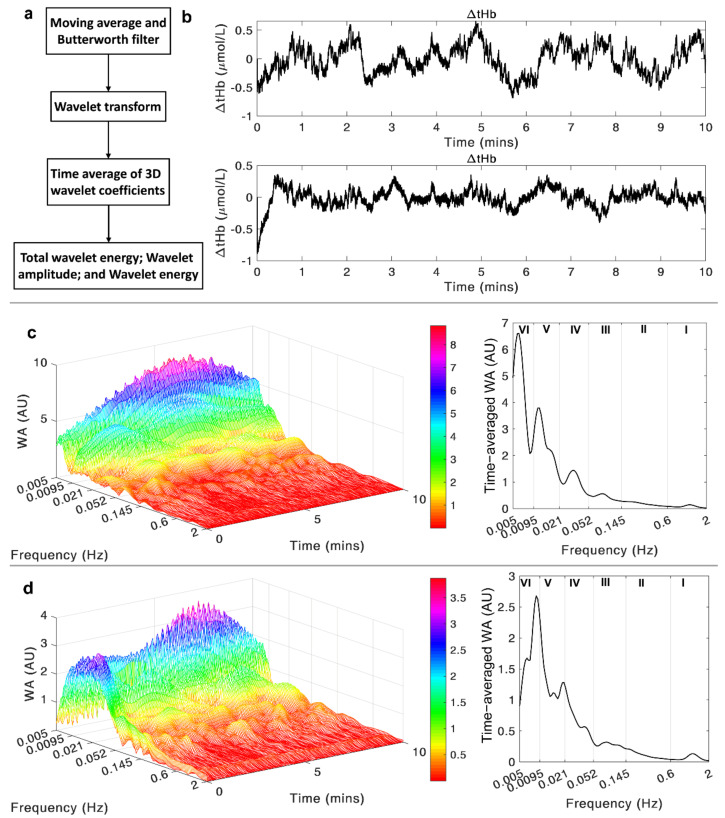
Figure 2.
(a) A flow-chart of the data analysis procedures; (b) An example of the two ΔtHb signals recorded through the given channel settings and filtered by the 12th-order Butterworth band-pass filter, with the upper signal from Ch1 and lower signal from Ch2; (c) The wavelet transform of the selected Ch1 signal in the time-frequency domain (left figure) and the time-averaged wavelet amplitude in the frequency domain (right figure); (d) The wavelet transform of the selected Ch2 signal in the time-frequency domain (left figure) and the time-averaged wavelet amplitude in the frequency domain (right figure).

