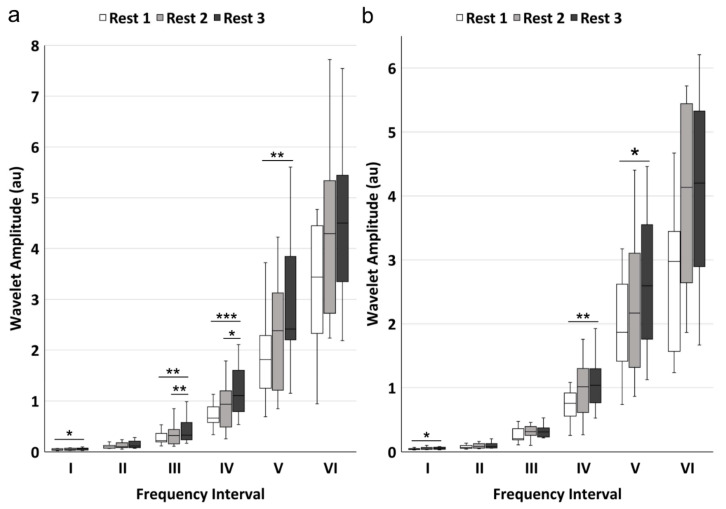
Figure 4.
The pairwise comparisons of the mean wavelet amplitude in the six frequency intervals: (a) signals from channel 1; (b) signals from channel 2. The white, light grey, and dark grey boxes show the rest phase 1, rest phase 2, and rest phase 3 conditions, respectively. Statistical significance: * p < 0.05, ** p < 0.01, *** p < 0.001 after Bonferroni correction.

