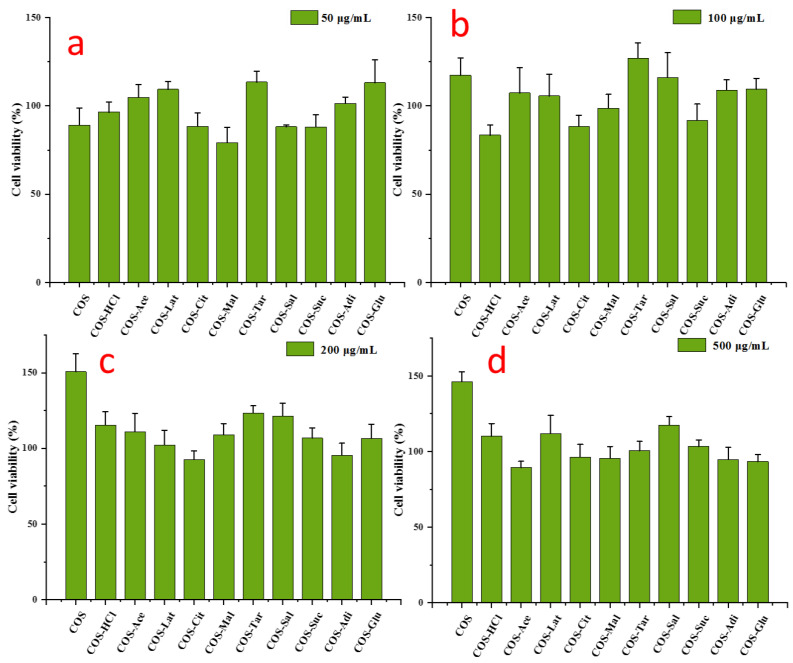
Figure 6.
The effects of chitooligosaccharide and its salts on cell viability. RAW 264.7 cells were treated with chitooligosaccharide and its salts (50–500 μg/mL) for 24 h. (a) 50 μg/mL; (b) 100 μg/mL; (c) 200 μg/mL; (d) 500 μg/mL. The values are presented as the mean ± SD (n = 3, which refers to the number of replicates).

