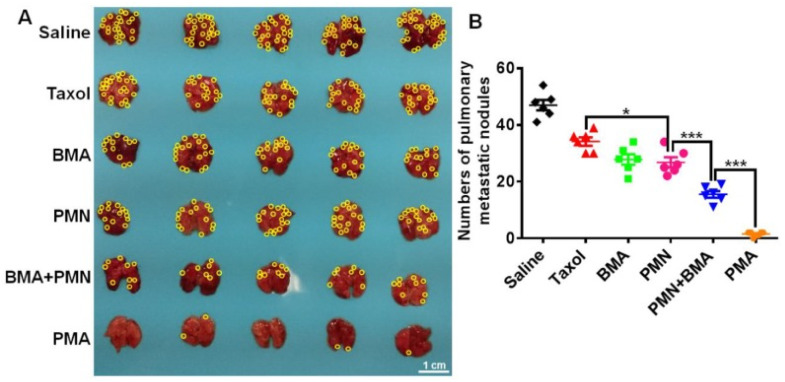
Figure 7.
Anti-metastasis effect of different formulations in 4T1 tumor-bearing mice. (A) Images of the lungs at day 25. (B) Quantitative analysis of the pulmonary metastatic nodules at day 25. The yellow circles indicate metastatic nodules on the lungs. (Scale bar: 1 cm) Data are shown as mean ± SD (n = 5). * p < 0.05 and *** p< 0.001 [244].

