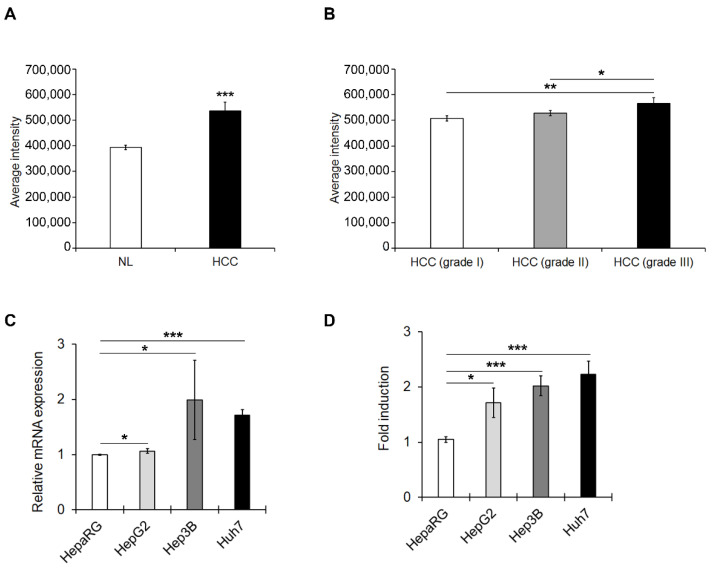
Figure 1.
PDE4D protein/gene expression levels in HCC tissues and HCC cell lines. (A) Expression levels of PDE4D measured as average intensity of fluorescence in HCC tissues (HCC) compared to normal liver samples (NL). (B) Expression levels of PDE4D measured as average intensity of fluorescence in HCC samples stratified by tumour histological grading. (C) qRT-PCR analysis of mRNA levels of PDE4D in HCC cells compared to well-differentiated HepaRG cells. GAPDH was used as a housekeeping gene. (D) The relative expression of PDE4D measured by semi-quantitative analysis of the Western blots in HCC cells normalized to GAPDH and reported as fold-changes compared to well-differentiated HepaRG cells. Data are the mean ± standard deviation (SD) of three independent experiments. Student t or Anova test. * p < 0.05; ** p < 0.01; *** p < 0.001.

