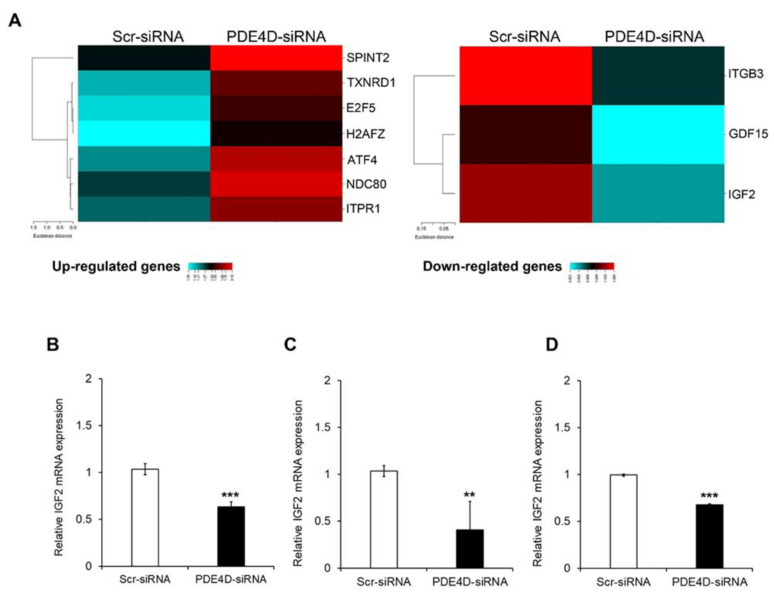
Figure 5.
Gene expression analysis after transient silencing of PDE4D gene. (A) Heatmap representation of cancer-related genes analysed by TaqMan OpenArray that were up-regulated (left panel) or down-regulated (right panel) in HepG2 cells silenced or not silenced for PDE4D. This image was generated using online tools provided by CIMminer (http://discover.nci.nih.gov/cimminer/home.do, accessed on 23 February 2021). IGF2 gene expression analysis by qRT-PCR in HepG2 (B), Hep3B (C), and Huh7 (D) cells 48 h after transient silencing. Data are the mean ± SD of three independent experiments. Student t test. ** p < 0.01; *** p < 0.001 versus Scr-siRNA.

