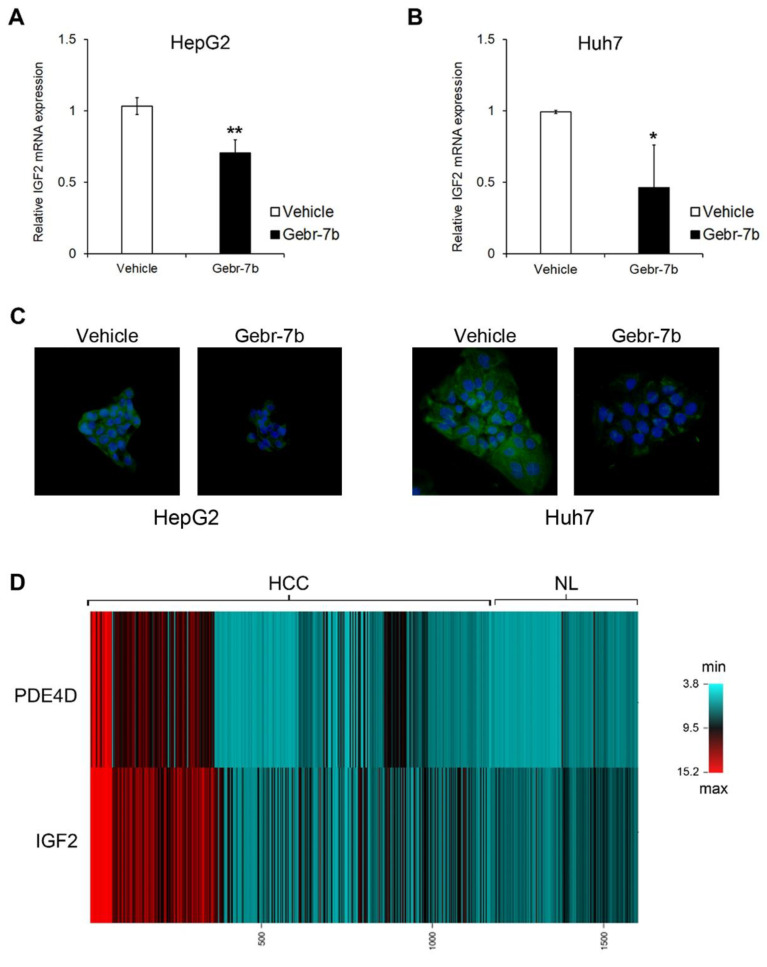
Figure 8.
The effect of Gebr-7b on IGF2 gene/protein expression. IGF2 gene expression analysis by qRT-PCR in HepG2 (A), and Huh7 (B) cells after 48 h of treatment with 5 μM Gebr-7b. Data are the mean ± SD of three independent experiments. Student t test. * p < 0.05; ** p < 0.011 versus vehicle. (C) Representative immunofluorescence images of IGF2 protein (green). Nuclei were counterstained with DAPI (blue). Magnification 40×. (D) Heatmap representation of PDE4D and IGF2 expression of 1465 HCCs compared to 465 NL. This image was generated using online tools provided by CIMminer (http://discover.nci.nih.gov/cimminer/home.do, accessed on 23 February 2021).

