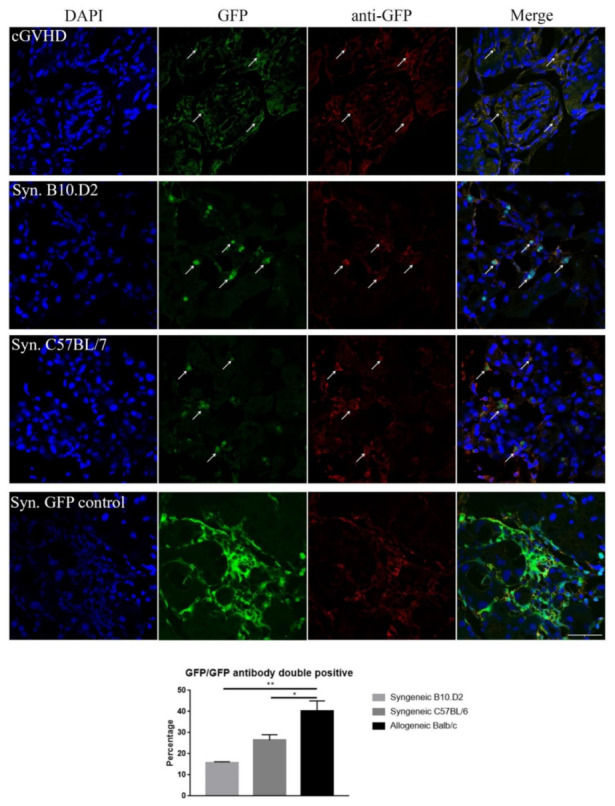
Figure 3.

GFP control staining for the lacrimal gland tissue. Anti-GFP staining in allogeneic (top, n = 7), syngeneic (center, C57BL/6 n = 7, B10.D2 n = 3), and GFP+ whole bone marrow syngeneic (positive control, bottom) mice. Arrows indicate GFP signals. DAPI (blue), GFP (green), collagen type I (red), and double positive cells (yellow). Scale bar = 50 µm, 400× magnification. Bar diagram displays mean ± SEM, * p < 0.05, ** p < 0.01.
