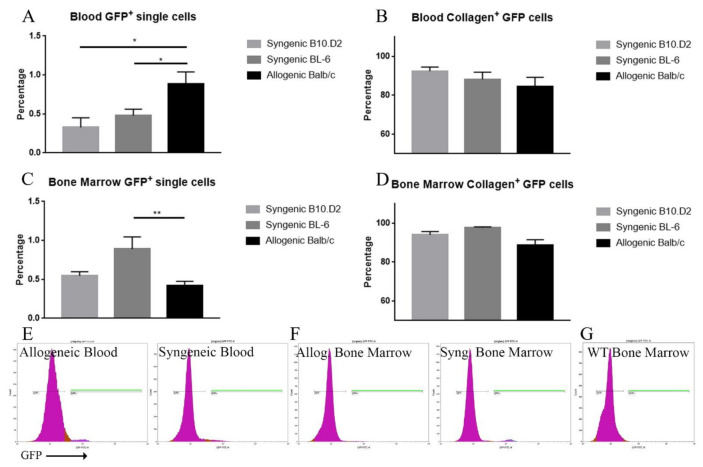
Figure 5.
FACS analysis of the blood and bone marrow of the allogeneic and syngeneic models. The left side (A,C) depicts the percentage of GFP+ cells among the single sorted cells. The right side (B,D) depicts the percentage of how many GFP+ single cells are also collagen type I positive. While the GFP+ cells in the blood were comparatively higher in the allogenic model (A), the opposite was the case in the bone marrow (C). The majority of GFP+ cells were also positive for collagen type I (B,D). Data are presented as mean ± SEM, * p < 0.05, ** p < 0.001. Allogeneic n = 17, syngeneic BL/6 n = 17, syngeneic B10.D2 n = 10. (E,F) shows representative GFP signal figures. GFP+ gates are highlighted in green. (G) Displays a wild-type control as reference.

