
Table 3.
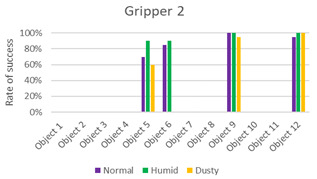
Experiments with Gripper 2. On the left, the table with success rate for every object, in the last column, the average for every object is calculated, and at the end of the table, the average success rate for every environment is determined. On the right, the graphic representation of Table 3 is reported.
| Experiments with Gripper 2 |
|
||||
| Obj. | Normal | Humid | Dusty | Average | |
| 1 | 0% | 0% | 0% | 0% | |
| 2 | 0% | 0% | 0% | 0% | |
| 3 | 0% | 0% | 0% | 0% | |
| 4 | 0% | 0% | 0% | 0% | |
| 5 | 70% | 90% | 60% | 73% | |
| 6 | 85% | 90% | 0% | 58% | |
| 7 | 0% | 0% | 0% | 0% | |
| 8 | 0% | 0% | 0% | 0% | |
| 9 | 100% | 100% | 95% | 98% | |
| 10 | 0% | 0% | 0% | 0% | |
| 11 | 0% | 0% | 0% | 0% | |
| 12 | 95% | 100% | 100% | 98% | |
| Avg. | 29% | 32% | 21% | 27% | |