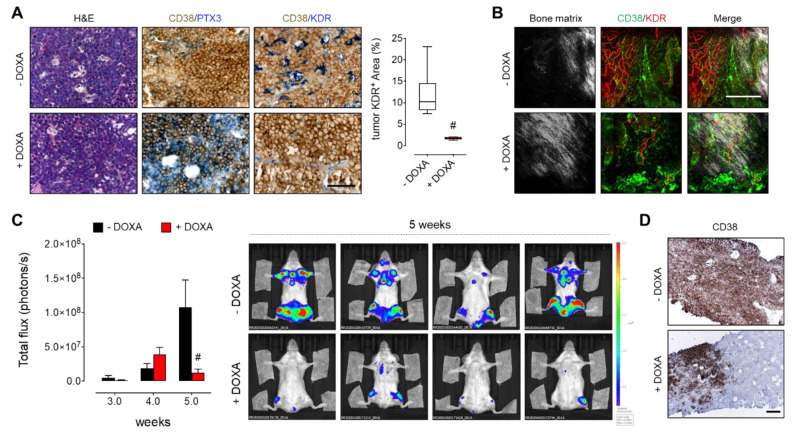
Figure 4.
PTX3 reduces MM cell BM colonization. Luciferase-expressing MM.1S PTX3 cells were injected i.v. in SCID Beige mice receiving (+DOXA) or not (-DOXA) doxycycline in the drinking water. (A) Histological analysis of femur sections five weeks after tumor cell injection. Tumor cells are detected in brown (CD38) and PTX3 and tumor vessels (KDR) are detected in blue. Scale bar: 100 μm. KDR positive area in tumor spots was quantified by ImageJ software. In box and whiskers graphs, boxes extend from the 25th to the 75th percentiles, lines indicate the median values and whiskers indicate the range of values. # p < 0.001. (B) Two-photon fluorescence microscopy analysis of femurs five weeks after tumor cell injection. Tumor cells are detected in green (CD38), tumor vessels (KDR) in red, and bone matrix is detected by second harmonic generation in grey. Scale bar: 200 μm. (C) Left panel: Quantification of bioluminescent signal of luciferase-expressing MM.1S cells up to 5 weeks after i.v. injection. Data are mean ± SEM, # p < 0.001. n = 8 mice/group. Right panel: Representative bioluminescence imaging of mice five weeks after MM cell i.v. injection. (D) Immunohistochemical analysis of femur sections five weeks after tumor cell injection. Tumor area are detected in brown (CD38). Scale bar: 200 μm.

