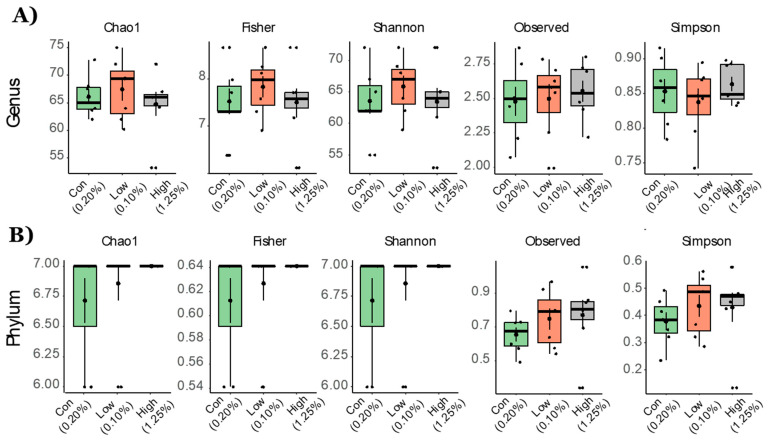
Figure 1.
Alpha diversity measurements for aged mice fed with TRP-deficient and TRP-rich diets. α-diversity indices at the (A) genus and (B) phylum levels. Statistical differences between the group’s control diet (n = 7), TRP-deficient diet (n = 7), and TRP-rich diet (n = 7) were determined by Kruskal Wallis one-way ANOVA for doses of TRP. Data are expressed as mean ± SE and all comparisons at all indices were non-significant.

