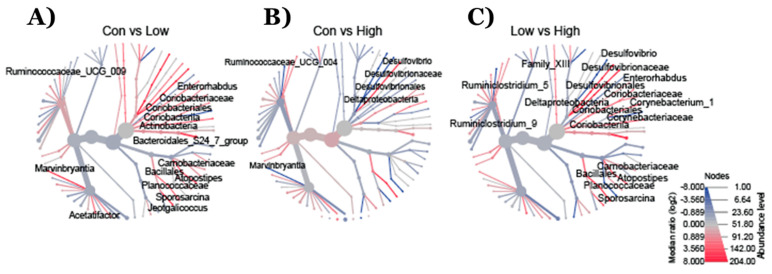
Figure 3.
(A) Phylogenetic heat tree illustrates the differences in relative bacterial abundance between groups. The data show the changes in the bacterial families in mice fed (A) TRP-deficient/low compared to TRP-normal, (B) TRP-rich/high compared to TRP-normal, and (C) TRP-rich/high compared to TRP-deficient diets. Control diet (n = 7), TRP-deficient diet (n = 7), and TRP-rich diet (n = 7). Red nodes represent more abundant bacterial families, whereas the blue nodes represent less abundant bacterial families.

