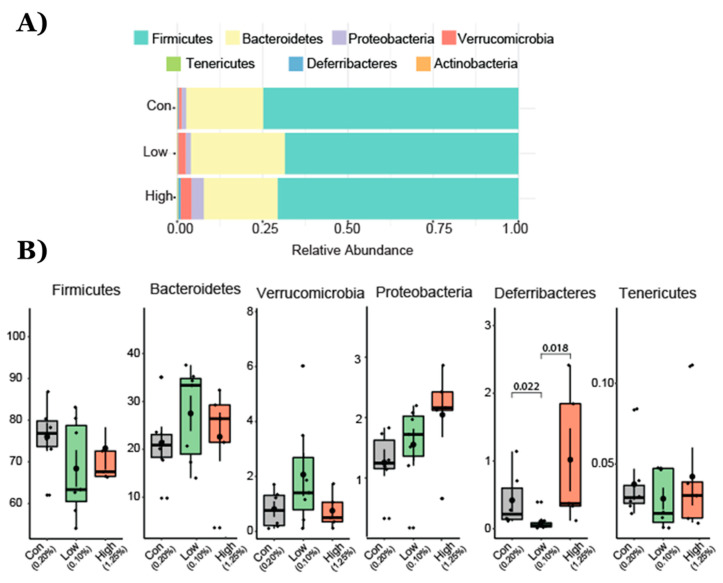
Figure 4.
Operational taxonomical unit (OTU) abundance at the phylum level in animals fed with TRP-normal, TRP-deficient, and TRP-rich diets. (A) Relative increase in Verrucomicrobia and Bacteroideate and decrease in Firmicutes and Deferribacteres. (B) Box and whisker plots depict the operational taxonomical units (OTUs) from different bacterial phyla presented among three groups of mice. p values are shown where the differences were found to be significantly different from each other. Cont (control 0.2% TRP, n = 7), def/low (0.1% TRP, n = 7), and high/rich (control 1.25% TRP, n = 7).

