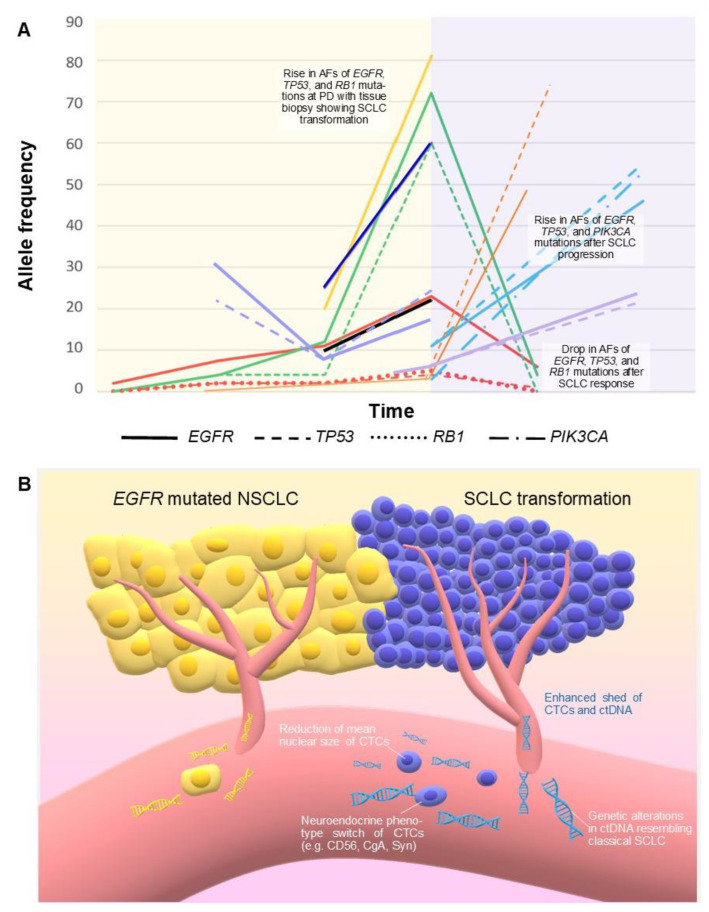
Figure 3.
(A) Correlation between SCLC transformation of EGFR mutated NSCLC and changes in mutation allele frequencies over time detected by ctDNA in 9 patients, as reported in 7 evaluable studies (Table 3). Each patient corresponds to a different color. Time not in scale. Red: Schmid 2020 [69]; dark blue: Pizzutilo 2019 [64]; yellow and black: 2 patients by Minari 2018 [66]; green: Iijima 2018 [67]; orange: 1 patient by Tsui 2018, the other 2 patients were not reported because the diagnosis of histologic transformation was performed under chemotherapy potentially active against SCLC [70]; light blue: Mooradian 2017 [68]; purple: 2 patients by Vendrell 2020; a third patient was not represented because AF at the moment of transformation was not reported [71]. The yellow background represents the EGFR mutated NSCLC; the pink background represents the histologic transformation. (B) Enhanced DNA tumor shed and a higher number of CTCs have been reported in SCLC compared with NSCLC. These features, together with qualitative changes in ctDNA and CTCs, could also characterize transformed SCLC. AF: allele frequency. CTCs: circulating tumor cells. ctDNA: circulating tumor DNA. PD: progressive disease.

