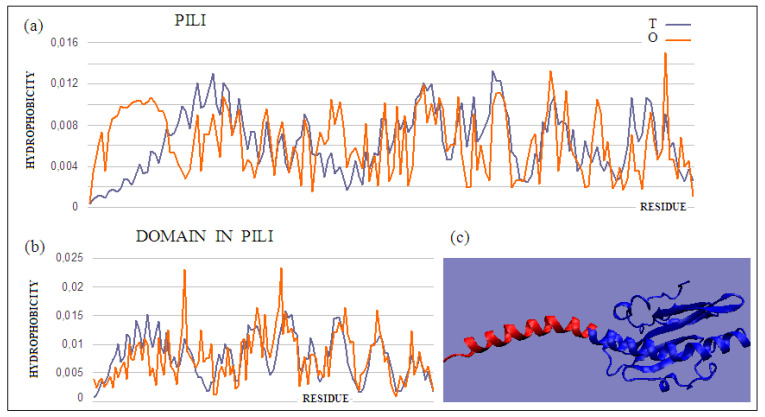
Figure 8.
T and O distributions for (a) a complete molecule showing a significant mismatch of the distribution expected in the N-terminal helix, and (b) the globular part of the molecule (navy blue part shown in (c)); (c) 3D presentation of the discussed monomeric pilin molecule. A fragment of the N-terminal helix (red) and a globular domain (blue) were distinguished. The program VMD was used to present the 3D form http://www.ks.uiuc.edu/Research/vmd/, accessed on 15 March 2021.

