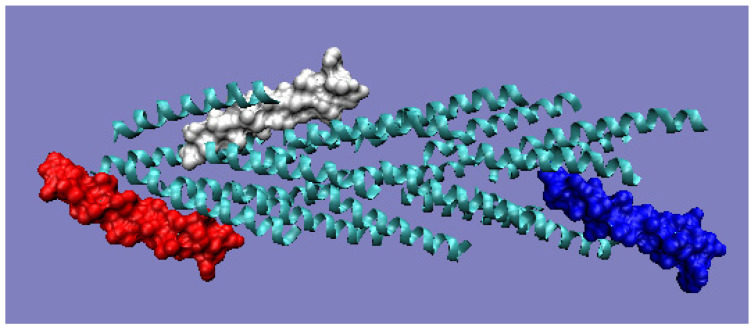
Figure 10.
3D presentation of filaments from ignicoccus hospitalis with highlighted monomers, the status of which is shown in the T and O profiles (Figure 9). Red: chain A; white: chain F; blue: chain U. The program VMD was used to present the 3D form http://www.ks.uiuc.edu/Research/vmd/, accessed on 15 March 2021.

