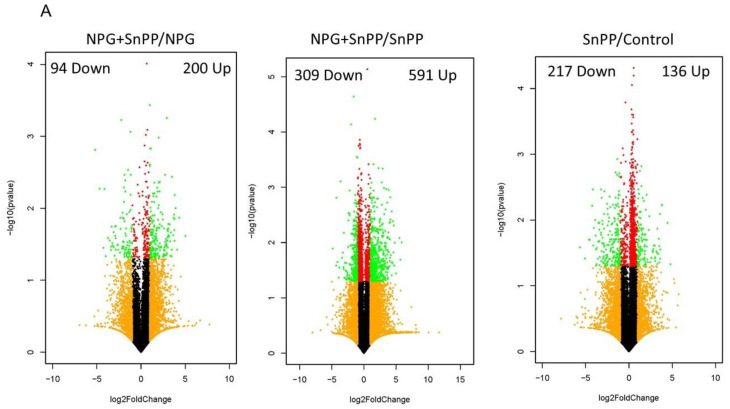
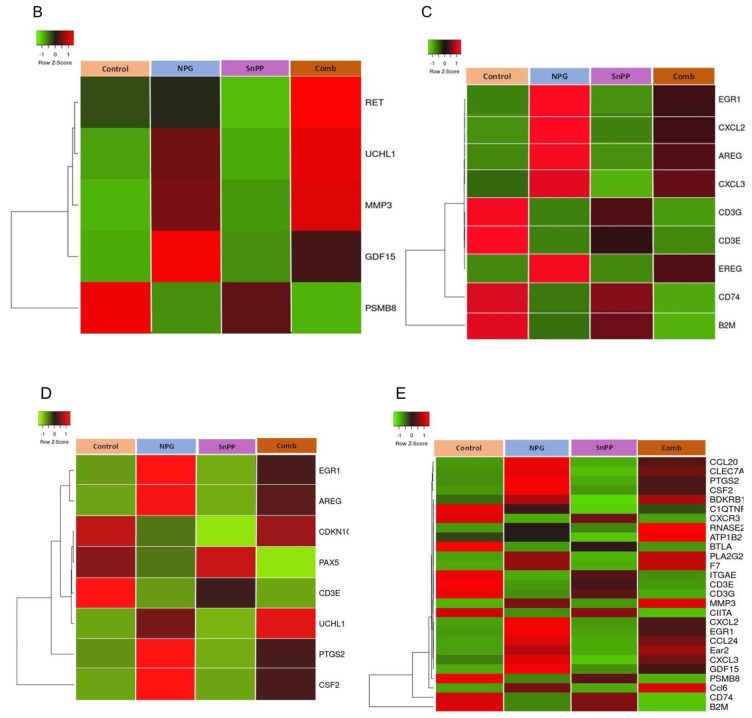
Figure 8.
Identification of difference in pancreatic tissue gene expression in different treatment groups. (A) Volcano plot of differentially expressed genes in combined treatment (NPG + SnPP) vs. NPG-alone mice. A total of 200 genes showed increased expression and 94 genes showed decreased expression (left). When combined treatment was compared to HO-1 inhibition alone, a total of 591 genes showed increased expression and 309 genes showed decreased expression (middle). Finally, when HO-1 inhibitor-treated mice were compared to non-treated controls, a total of 136 genes showed increased expression and 217 genes showed decreased expression (Right). (B–E) Heat map showing the effect of NPG, SnPP, and their combination on the clustering of differentially expressed genes in orthotopic pancreas tumors. RNA-Seq was performed on tumors obtained from the non-treated control, NPG, SnPP, and NPG+SnPP (combined)-treated mice. (B) Heat maps for differentially expressed genes from for apoptosis. (C) Cancer cell invasion and proliferation, (D) cell cycle, (E) and immune cell trafficking gene pathways are shown for the 4 treatment groups (control, NPG, SnPP, and combined; n = 2 each). The color gradient represents low expression (green) to high expression (red).


