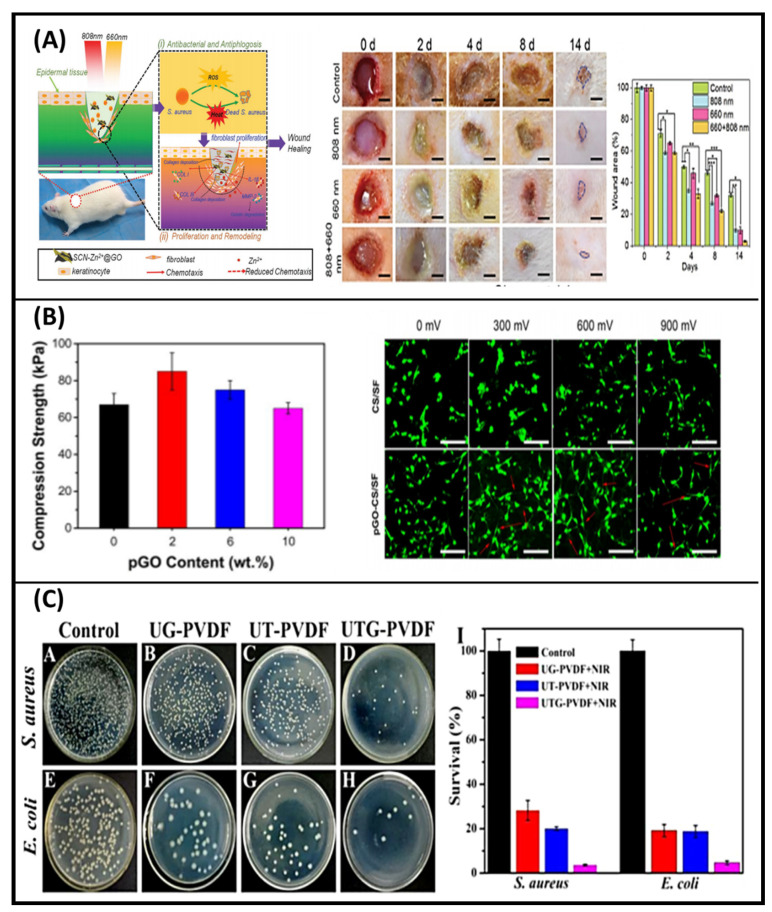
Figure 5.
(A) Schematic diagram of SCN-Zn2+@GO for rapid bacteria-killing and wound healing and a rat model of infectious wounds used to evaluate the healing ability of SCN-Zn2+@GO for different light irradiation and corresponding wound photographs after 0, 2, 4, 8, and 14 d. Graph shows the rate of wound healing calculated and comparison with original wounded areas of rats. The error bars indicate means ± SD (n = 3): * p < 0.05, ** p < 0.01, *** p < 0.001 [71]. (B) Compression strength of PDA reduced GO-CS/SF scaffolds with increasing pGO contents (left) and CLSM images of C2C12 myoblasts at day 3 (right) [76]. (C) Images of S. aureus and E.coli colonies growth on agar plates with UTG-PVDF membrane in the dark (A,E), and upon NIR irradiation on UG-PVDF (B,F), UT-PVDF (C,G), and UTG-PVDF (D,H), and histogram showing relative bacterial survival (right). [85].

