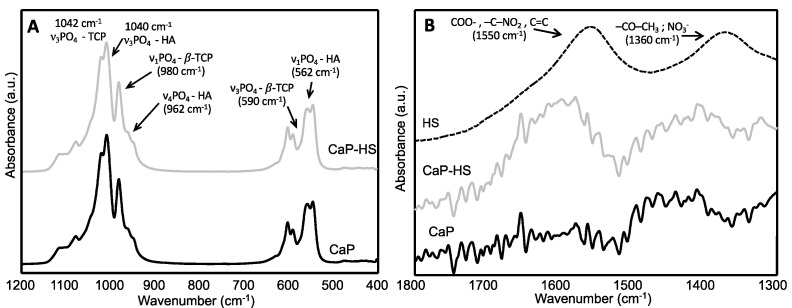
Figure 3.
FT-IR spectra of CaP, CaP–HS and HS. The range of the spectra where the main IR bands of HA and β-TCP appear (1200–400 cm−1) is reported on the left (A), while a magnification of the FT-IR spectra in the region where the typical IR bands of HS (1800–1300 cm−1) occur is reported on the right (B).

