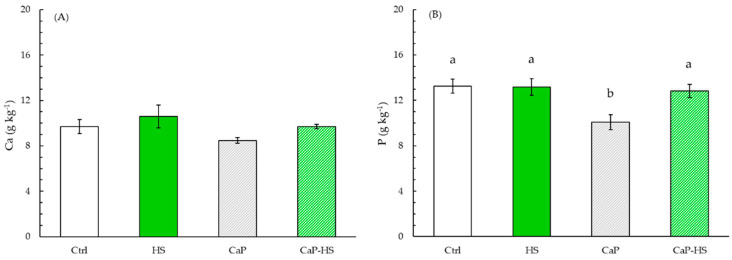
Figure 8.
Concentration of Ca (A) and P (B) in leaves of Valerianella locusta. Data are mean ± standard deviation (n = 4). When the interaction between experimental factors (CaP × HS) was significant at ANOVA, different letters were used to indicate statistically significant differences between treatments at Tukey’s post-hoc test (p ≤ 0.05).

